
User Manual v12.3.0 User Manual

346 Brocade Network Advisor SAN User Manual
53-1003154-01
Traffic flow dashboard monitors
7
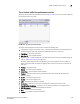
Accessing additional data from traffic flow performance monitors
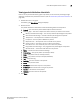
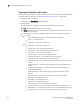
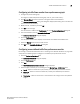
• Right-click a row in the table to access the shortcut menu and select one of the following
options:
- Show Graph/Table — Launches the Flow Graphing dialog box with the selected measures
(sub-flows) to be plotted.
- Locate — Move the focus to the SAN tab with the associated switch highlighted.
- Monitor — Launches the Monitor - Flow Vision dialog box with the selected sub-flows in the
Active Flows list.
- Table — Use to configure the table (refer to “Customizing application tables” on page 369).
• Right-click column head to configure the table (refer to “Customizing application tables” on
page 369).
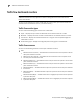
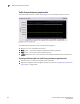
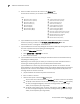
Time series traffic flow performance monitor
The time series traffic flow performance monitors display (Figure 149) the selected measure in a
chart.
FIGURE 149 Traffic flow performance monitor example
The time series traffic flow performance monitor includes the following data:
The time series performance monitor includes the following data:
• Monitor title — The user-defined monitor title.
• Value (y-axis) — The number of objects affected by this monitor.
• Time (x-axis) — The date and time the monitor collected the data.
• Legend (below the x-axis) — The line color and the associated data that each line represents.
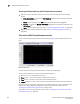
Place the cursor on a data point in graph line to view details. Place the cursor on an Event icon to
view the event details. Right-click the graph to access the graph shortcut menu (refer to
“Configuring the performance graph display” on page 1115).
To configure a time series performance monitor, refer to “Configuring a user-defined traffic flow
performance monitor” on page 347.