
User Manual v12.3.0 User Manual

Brocade Network Advisor SAN User Manual 359
53-1003154-01
Master Log
8
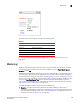
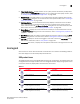
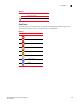
FIGURE 155 Utilization Legend
The colors and their meanings are outlined in the following table.
For more information about the utilization legend, refer to “SAN connection utilization” on
page 1112.
Master Log
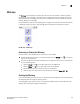
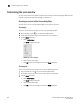
The Master Log, which displays in the lower area of the main window, lists the events and alerts
that have occurred on the SAN. If you do not see the Master Log, select View > Show Panels >
All Panels or press F5.
The default order of the Master Log columns is ‘Severity’, ‘Acknowledged’, ‘Last Event Server Time’,
and ‘Description’. Which columns are displayed and in what order can be controlled through the
“Customize Columns” dialog, as described in “Displaying columns” and in “Changing the order of
columns”. You can sort the Master Log by clicking a column heading. By default, the Master Log is
sorted by the Last Event Server Time column. To filter information in the Master Log, refer to
“Filtering events in the Master Log” on page 1322. To view event properties, refer to “Displaying
event properties from the Master Log” on page 1319.
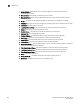
The following fields and columns are included in the Master Log:
• Severity — The severity of the event. When the same event (Warning or Error) occurs
repeatedly, the Management application automatically eliminates the additional occurrences.
For more information about events, refer to “Fault Management” on page 1255. For a list of
the event icons, refer to “Event icons” on page 367.
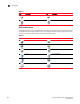
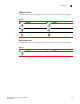
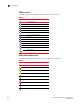
TABLE 30
Line Color Utilization Defaults
Red line 80% to 100% utilization
Yellow line 40% to 80% utilization
Blue line 1% to 40% utilization
Gray line 0% to 1% utilization
Black line Utilization disabled