
User Manual v12.3.0 User Manual

Brocade Network Advisor SAN User Manual 645
53-1003154-01
DCB performance
16
Historical performance graph
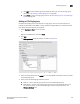
The Historical Performance Graph dialog box enables you to customize how you want the historical
performance information to display.
Generating a historical performance graph
You can generate a historical performance graph by selecting both Network OS and FOS DCB
devices from the IP Tab or by selecting only Network OS DCB devices from the IP tab.
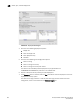
1. Select a DCB port from the DCB Configuration dialog box, and select Historical Graph from the
Performance list.
A message displays, prompting you to close the DCB Configuration dialog.
2. Click OK to close the DCB Configuration dialog and open the Performance dialog box.
The Historical Performance Graph dialog box displays.
For complete information about Real Time Performance Graphs, refer to “SAN real-time
performance data” on page 1074.
Historical performance report
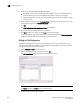
The Historical Performance Report dialog box enables you to customize how you want the historical
performance information to display.
Generating a historical performance report
1. Select a DCB port from the DCB Configuration dialog box, and select Historical Report from the
Performance list.
A message displays, prompting you to close the DCB Configuration dialog box.
2. Click OK to close the DCB Configuration dialog and open the Performance dialog box.
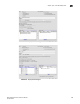
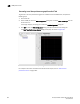
The Historical Performance Report dialog box displays, as shown in Figure 248.
FIGURE 248 Historical Performance Report dialog box
For complete information about Historical Performance Graphs, refer to “SAN historical
performance data” on page 1078.