
(Supporting ADX v03.1.00) Owner's manual
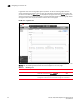
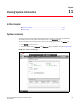
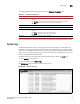
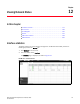
Table Of Contents
- Contents
- Preface
- Introduction to the Brocade Virtual ADX Web Interface
- Navigating the Web Interface
- Navigating the Dashboard
- Configuration Overview
- System Settings
- Network Settings
- Traffic Settings
- GSLB Settings
- Security Settings
- Monitoring Overview
- Viewing System Information
- Viewing Network Status
- Viewing Traffic Statistics
- Viewing Security Statistics
- Maintenance Overview
- Managing Software Images
- Restarting the System
- License Management
- Packet Capture
- Accessing the CLI
- Retrieving System Information for Technical Support
- Troubleshooting
- Config Template XML Schema
- Managing Config Templates through the CLI

Brocade Virtual ADX Graphical User Interface Guide 171
53-1003242-01
Chapter
10
Monitoring Overview
In this chapter
•Navigating the monitor tab . . . . . . . . . . . . . . . . . . . . . . . . . . . . . . . . . . . . . . 171
Navigating the monitor tab
The Monitor tab is the third tab in the Brocade Virtual ADX web interface. You can use the Monitor
tab to monitor the system, network, traffic, or security settings on a Brocade Virtual ADX. When you
click the Monitor tab, the following menus are displayed in the menu bar:
• System — Allows you to view the information specific to system summary and system logs.
• Network — Allows you to view the information specific to interfaces, IP statistics, Address
Resolution Protocol (ARP), and Media Access Control (MAC).
• Traf fic — Allows you to view the information specific to virtual server, real server, health checks,
content switching, scripts, and sessions.
• Security — Allows you to view the information specific to Secure Socket Layer (SSL).
By default, the Brocade Virtual ADX web interface displays the System menu after you click the
Monitor tab. The System page displays the Summary and System Logs.
Click a menu that represents the primary task that you want to perform from the menu bar, the
corresponding entities specific to the menu are displayed in the sidebar. From the sidebar, select
an entity that represents a configuration feature. The corresponding Summary page with a list of
configured entities specific to the feature, in tabular format, is displayed in the main page.
For example, when you select the Real Servers entity from the sidebar, the main page displays a
summary page with the list of real servers configured on the Brocade Virtual ADX. The list displays
all the configured entries with 30 entries in each page. You can navigate to view the next or
previous set of configuration information by clicking Next or Previous at the bottom of the Summary
page. Click First or Last to go to the most recent or least recent entries. Also, you can select the
page number from the list, to go to a specific page. To view the detailed statistics of a feature,
select an entry from the list and click Details at the bottom of the Summary page.
In the Details page, the statistical data can be viewed in graphical or tabular format. You are
allowed to switch between tabular and graphical format. To switch the view, click Graph or Details
on the top right corner of that page. For example, click the Network menu from the menu bar and
select IP from the sidebar to view the IP configuration information statistics as shown in
Figure 134. The option to view the statistical data in graphical format is present only for some of
the pages.