
(Supporting ADX v03.1.00) Owner's manual
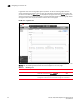
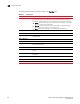
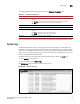
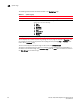
Table Of Contents
- Contents
- Preface
- Introduction to the Brocade Virtual ADX Web Interface
- Navigating the Web Interface
- Navigating the Dashboard
- Configuration Overview
- System Settings
- Network Settings
- Traffic Settings
- GSLB Settings
- Security Settings
- Monitoring Overview
- Viewing System Information
- Viewing Network Status
- Viewing Traffic Statistics
- Viewing Security Statistics
- Maintenance Overview
- Managing Software Images
- Restarting the System
- License Management
- Packet Capture
- Accessing the CLI
- Retrieving System Information for Technical Support
- Troubleshooting
- Config Template XML Schema
- Managing Config Templates through the CLI
172 Brocade Virtual ADX Graphical User Interface Guide
53-1003242-01
Navigating the monitor tab
10
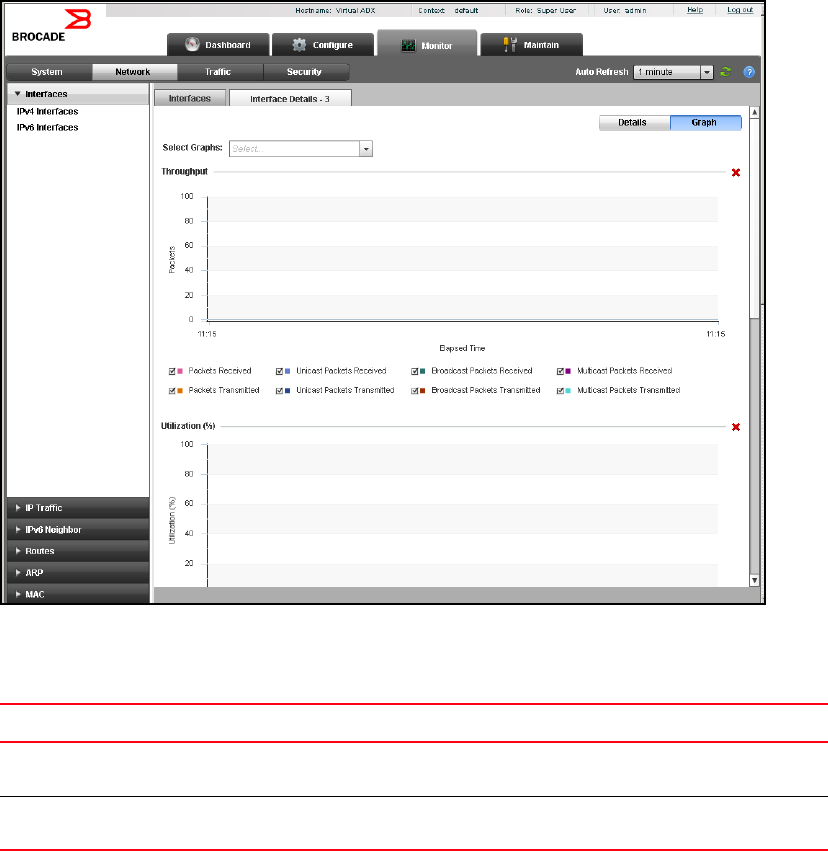
In graphical view, some of the graphs appear by default. To view or hide the graphs based on
various networking parameters, select or clear the check boxes corresponding to the graphs that
you want to view from the Select Graph list displayed in top right corner of the Details page. You can
also click the close button that is displayed on the each individual graphs to close the graph. Select
the legend check boxes to plot the relevant statistics data on the graph.
FIGURE 134 IP graphical view
There are common icons that are displayed on the top right corner of all the main pages within the
Monitor tab. The following table describes the icons displayed on the main page:
TABLE 34 Monitoring icons
Icon Description
Filter Allows you to filter the data in the Summary page. Click the Filter icon and
select the criteria from the Filter
Criteria list.
Auto refresh Refresh the monitoring page based on the changes made to the
configuration. Select the interval at which the page has to refreshed.