
(Supporting ADX v03.1.00) Owner's manual
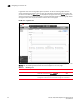
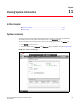
Table Of Contents
- Contents
- Preface
- Introduction to the Brocade Virtual ADX Web Interface
- Navigating the Web Interface
- Navigating the Dashboard
- Configuration Overview
- System Settings
- Network Settings
- Traffic Settings
- GSLB Settings
- Security Settings
- Monitoring Overview
- Viewing System Information
- Viewing Network Status
- Viewing Traffic Statistics
- Viewing Security Statistics
- Maintenance Overview
- Managing Software Images
- Restarting the System
- License Management
- Packet Capture
- Accessing the CLI
- Retrieving System Information for Technical Support
- Troubleshooting
- Config Template XML Schema
- Managing Config Templates through the CLI
Brocade Virtual ADX Graphical User Interface Guide 173
53-1003242-01
Chapter
11
Viewing System Information
In this chapter
•System summary . . . . . . . . . . . . . . . . . . . . . . . . . . . . . . . . . . . . . . . . . . . . . . 173
•System logs . . . . . . . . . . . . . . . . . . . . . . . . . . . . . . . . . . . . . . . . . . . . . . . . . . 175
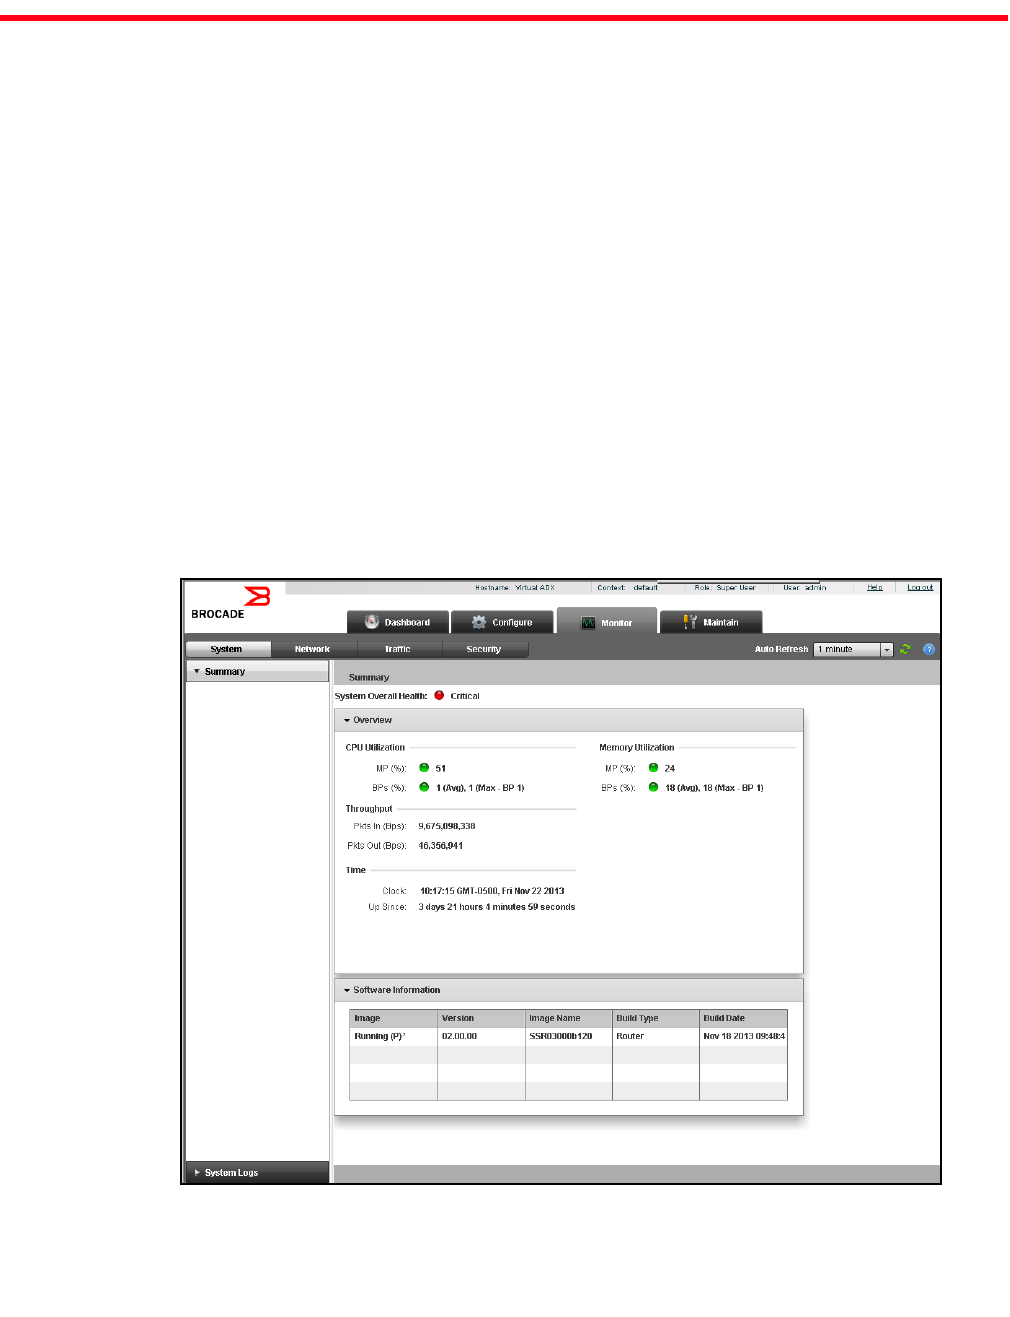
System summary
You can monitor the percentage of CPU utilization and memory currently used by the Brocade
Virtual ADX, software, and module-related information in the Summary page.
To view the system summary information, perform the following steps within the Monitor tab.
1. Click System on the menu bar.
2. From the sidebar, select Summary. The Summary page is displayed, as shown in Figure 135.
FIGURE 135 System - Summary page