
(Supporting ADX v03.1.00) Owner's manual
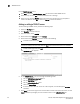
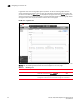
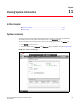
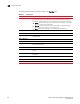
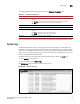
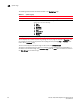
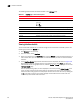
Table Of Contents
- Contents
- Preface
- Introduction to the Brocade Virtual ADX Web Interface
- Navigating the Web Interface
- Navigating the Dashboard
- Configuration Overview
- System Settings
- Network Settings
- Traffic Settings
- GSLB Settings
- Security Settings
- Monitoring Overview
- Viewing System Information
- Viewing Network Status
- Viewing Traffic Statistics
- Viewing Security Statistics
- Maintenance Overview
- Managing Software Images
- Restarting the System
- License Management
- Packet Capture
- Accessing the CLI
- Retrieving System Information for Technical Support
- Troubleshooting
- Config Template XML Schema
- Managing Config Templates through the CLI

176 Brocade Virtual ADX Graphical User Interface Guide
53-1003242-01
System logs
11
The following table describes the fields available in the System Log page.
The list displays the number of system log (syslog) entries per page as selected by Page size. You
can navigate to view the next or previous set of syslog entries by clicking Next or Previous at the
bottom of the Summary page.
To save a local copy of all the system logs on the server, click Download Logs.
The logs can be filtered based on severity or message and also the logs can be downloaded in a
text file. To save the filtered logs, click Download Logs. Click the Filter icon and select the criteria in
the Filter Criteria list to filter the logs.
TABLE 37 System Log page
Field Description
Timestamp Displays the date and time when the entry was logged.
Severity Displays the severity of the event occurring on the Brocade Virtual ADX. The
severity can be one of the following:
• Alert
• Critical
• Debugging
• Emergency
• Error
• Informational
• Notification
• Warning
Messages Displays the log message.