
(Supporting ADX v03.1.00) Owner's manual
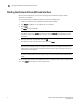
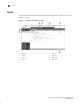
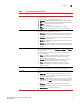
Table Of Contents
- Contents
- Preface
- Introduction to the Brocade Virtual ADX Web Interface
- Navigating the Web Interface
- Navigating the Dashboard
- Configuration Overview
- System Settings
- Network Settings
- Traffic Settings
- GSLB Settings
- Security Settings
- Monitoring Overview
- Viewing System Information
- Viewing Network Status
- Viewing Traffic Statistics
- Viewing Security Statistics
- Maintenance Overview
- Managing Software Images
- Restarting the System
- License Management
- Packet Capture
- Accessing the CLI
- Retrieving System Information for Technical Support
- Troubleshooting
- Config Template XML Schema
- Managing Config Templates through the CLI
Brocade Virtual ADX Graphical User Interface Guide 7
53-1003242-01
Chapter
3
Navigating the Dashboard
In this chapter
•Dashboard overview . . . . . . . . . . . . . . . . . . . . . . . . . . . . . . . . . . . . . . . . . . . . . 7
•System view . . . . . . . . . . . . . . . . . . . . . . . . . . . . . . . . . . . . . . . . . . . . . . . . . . . 12
•Traffic view . . . . . . . . . . . . . . . . . . . . . . . . . . . . . . . . . . . . . . . . . . . . . . . . . . . . 13
Dashboard overview
Use the Dashboard tab to monitor the health and performance of the system based on statistical
counters specific to the Brocade Virtual ADX or to the traffic flowing through the Brocade Virtual
ADX. See Figure 3.
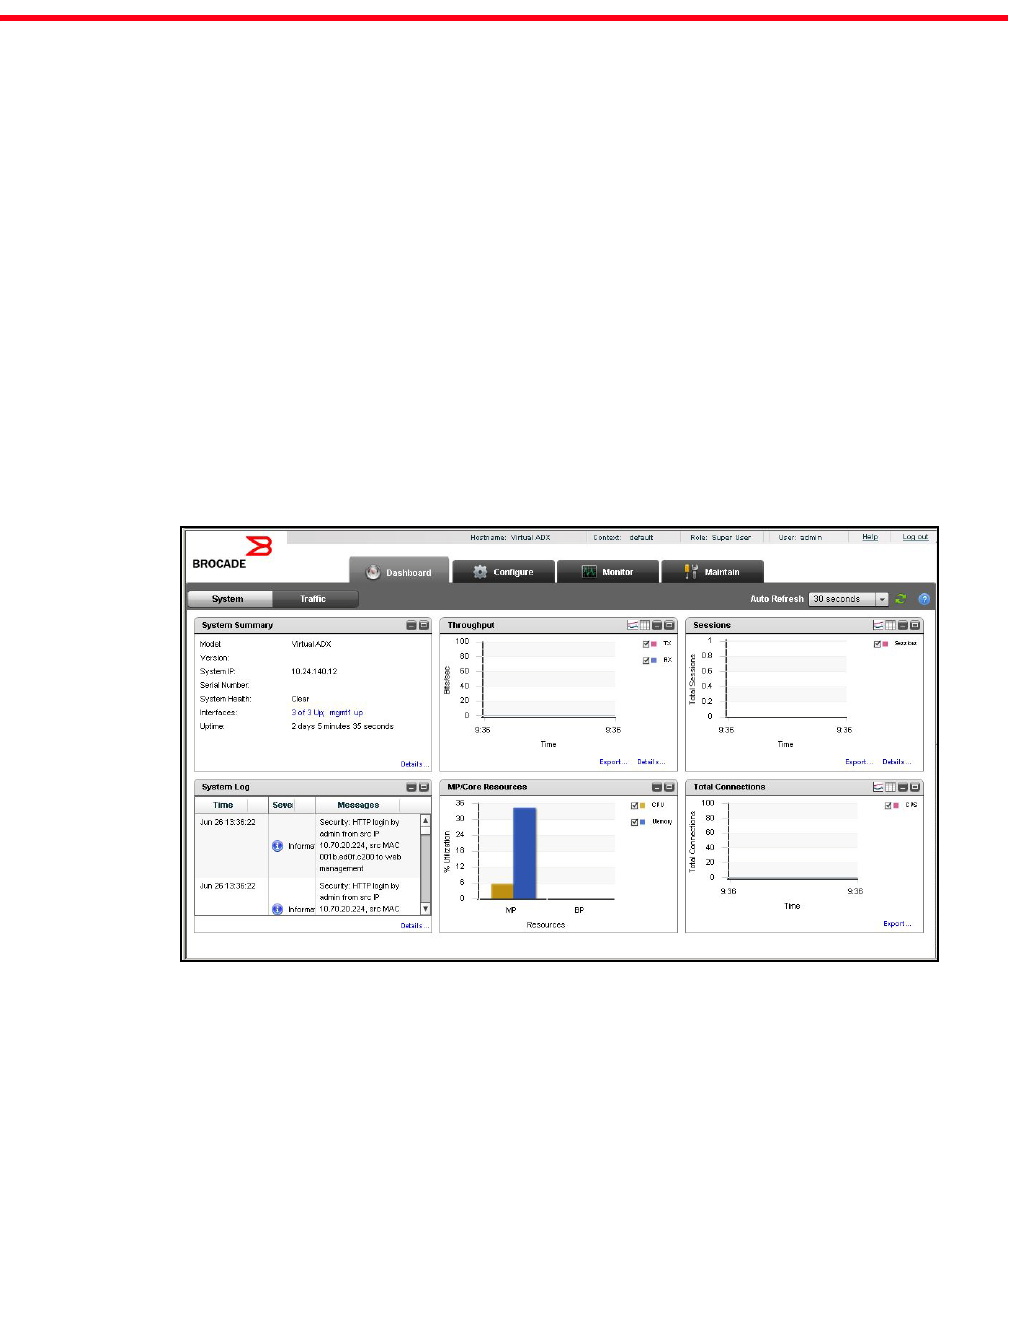
FIGURE 3 Dashboard tab
From the menu bar, you can view either System or Traffic dashboard. The System dashboard
provides a summary of the entire system and includes device information such as CPU utilization,
memory utilization, throughput, and system state. The Traffic dashboard provides a summary of the
virtual servers and real servers configured on the Brocade Virtual ADX and the related traffic
information such as connections per second, average response times per service and overall traffic
distribution. By default, the Brocade Virtual ADX web interface displays the System dashboard after
you log in.