
(Supporting ADX v03.1.00) Owner's manual
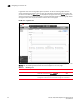
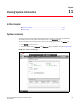
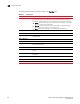
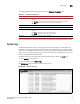
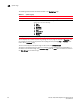
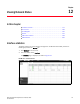
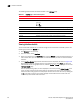
Table Of Contents
- Contents
- Preface
- Introduction to the Brocade Virtual ADX Web Interface
- Navigating the Web Interface
- Navigating the Dashboard
- Configuration Overview
- System Settings
- Network Settings
- Traffic Settings
- GSLB Settings
- Security Settings
- Monitoring Overview
- Viewing System Information
- Viewing Network Status
- Viewing Traffic Statistics
- Viewing Security Statistics
- Maintenance Overview
- Managing Software Images
- Restarting the System
- License Management
- Packet Capture
- Accessing the CLI
- Retrieving System Information for Technical Support
- Troubleshooting
- Config Template XML Schema
- Managing Config Templates through the CLI
178 Brocade Virtual ADX Graphical User Interface Guide
53-1003242-01
Interface statistics
12
The following table describes the fields available in the Interface page.
Viewing interface details
To view the detailed statistics of an interface configured on the Brocade Virtual ADX, perform the
following steps within the Monitor tab.
1. Click Network on the menu bar.
2. From the sidebar, select Interface.
3. Select an interface from the Interfaces table and click Details to view the detailed statistics of
that interface. Also, you can double click an interface for which you want to view the detailed
statistics.
4. A new Interface Details page tab with detailed statistics is displayed, as shown in Figure 138.
Alternatively, to view the interface details in the graphical format, click Graph. To switch the
view between tabular and graphical format, click the Details or Graph on top right corner of the
Interface Details page.
You can specify which graphs you want displayed in this view by clicking Select Graphs at the
top of the page and marking the check boxes for the graphs you want to see. Unmarking a
check box causes that graph not to be displayed. You can also remove the chart by clicking the
red X at the right end of the chart header. Display of individual features of each chart are
controlled by check boxes below each chart.
TABLE 38 Interface page - fields and descriptions
Field Description
Port Displays the name of the port.
Status Displays the status of the interface. The interface status can be one of the
following:
• Up
• Down
Trunk Displays the trunk group, if the interface is a member of any trunk group.
Rx Packets Displays the total number of packets received by the interface.
Tx Packets Displays the total number of packets transmitted by the interface.
Rx Bytes Displays the total number of bytes received by the interface.
Tx Bytes Displays the total number of bytes transmitted by the interface.
Collision Displays the number of collisions on the interface.
Errors Displays the number of errors on the interface.