
(Supporting ADX v03.1.00) Owner's manual
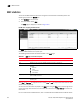
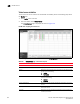
Table Of Contents
- Contents
- Preface
- Introduction to the Brocade Virtual ADX Web Interface
- Navigating the Web Interface
- Navigating the Dashboard
- Configuration Overview
- System Settings
- Network Settings
- Traffic Settings
- GSLB Settings
- Security Settings
- Monitoring Overview
- Viewing System Information
- Viewing Network Status
- Viewing Traffic Statistics
- Viewing Security Statistics
- Maintenance Overview
- Managing Software Images
- Restarting the System
- License Management
- Packet Capture
- Accessing the CLI
- Retrieving System Information for Technical Support
- Troubleshooting
- Config Template XML Schema
- Managing Config Templates through the CLI
Brocade Virtual ADX Graphical User Interface Guide 207
53-1003242-01
Virtual servers
13
Virtual server ports
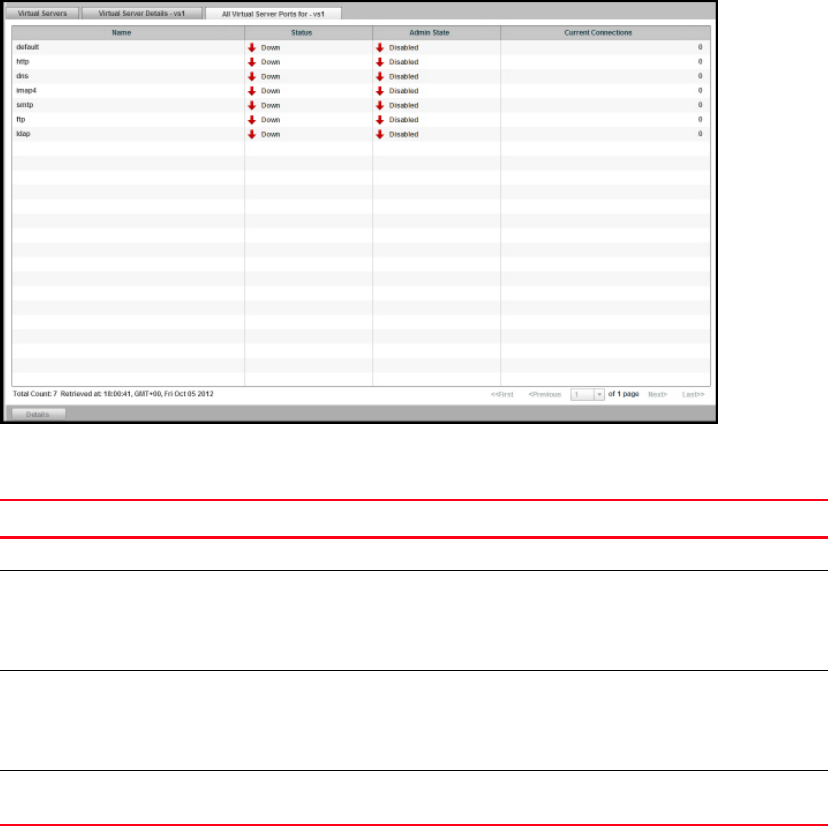
To view the virtual server port statistics on the Brocade Virtual ADX, perform the following steps
within the Monitor tab.
1. Click Traffic on the menu bar.
2. From the sidebar, select Virtual Servers.
3. Click Ports at the bottom of the Virtual Servers page.
A new All Virtual Server Ports page is displayed, as shown in Figure 148.
FIGURE 148 Displaying the virtual server ports
The following table describes the fields available in the Virtual Server Ports page.
TABLE 62 Virtual Server Ports page - fields and descriptions
Field Description
Name Displays the name of the virtual server port.
Status Displays the health of the virtual server ports. The health status
can be one of the following:
• Up
• Down
Admin State Displays the admin state of the virtual server ports. The port status
can be one of the following:
• Healthy
• Unhealthy
Current Connections Displays the number of current open connections on the virtual
server ports.