
(Supporting ADX v03.1.00) Owner's manual
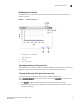
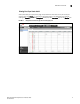
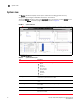
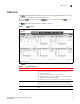
Table Of Contents
- Contents
- Preface
- Introduction to the Brocade Virtual ADX Web Interface
- Navigating the Web Interface
- Navigating the Dashboard
- Configuration Overview
- System Settings
- Network Settings
- Traffic Settings
- GSLB Settings
- Security Settings
- Monitoring Overview
- Viewing System Information
- Viewing Network Status
- Viewing Traffic Statistics
- Viewing Security Statistics
- Maintenance Overview
- Managing Software Images
- Restarting the System
- License Management
- Packet Capture
- Accessing the CLI
- Retrieving System Information for Technical Support
- Troubleshooting
- Config Template XML Schema
- Managing Config Templates through the CLI
12 Brocade Virtual ADX Graphical User Interface Guide
53-1003242-01
System view
3
System view
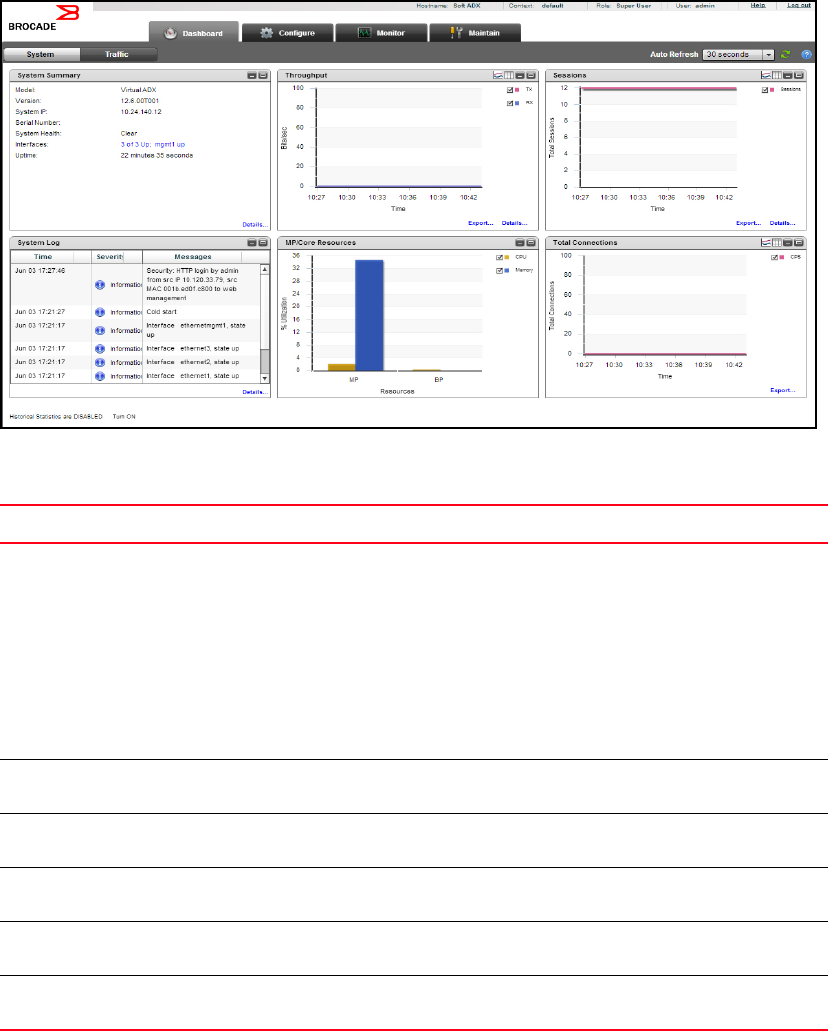
The System dashboard displays various system information including general summary,
throughput, log messages, established connections, and sessions.
To view the System dashboard, select the Dashboard tab in the task bar and click System on the
menu bar. The System dashboard page is displayed, as shown in Figure 6.
FIGURE 6 System dashboard
The System Dashboard contains six pods. See Table 2.
TABLE 2 System Dashboard pods
Pod Description
System Summary Displays system details including:
• Model
• Version
• System IP
• Serial Number
• System Health
• HA Mode
• Interfaces
• Uptime
Throughput Allows you to monitor the total number of packets received and
transmitted by the Brocade Virtual ADX.
Sessions Allows you to monitor the total number of sessions created with respect to
time.
System Log Allows you to monitor the system log messages and errors in the Brocade
Virtual ADX
MP/Core Resources Allows you to monitor the memory and CPU utilization in the Brocade
Virtual ADX
Total Connections Allows you to monitor the total number of connections established with the
Brocade Virtual ADX.