
(Supporting ADX v03.1.00) Owner manual


386 Brocade Virtual ADX Server Load Balancing Guide
53-1003247-01
Displaying configuration information
B
Displaying configuration information
This section contains the following sections:
• “Showing aggregate health of tracked ports” on page 386
• “Auto repeat of show command output” on page 387
• “Clearing all session table entries” on page 387
• “Clearing the connections counter” on page 388
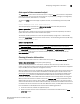
Showing aggregate health of tracked ports
If a real server port goes down, none of the track port groups on the real server are considered for
load balancing. To check the health of track-group state, use the following command.
Virtual ADX(config)#show track-group-state
This command displays the state of all configured track groups on the Brocade Virtual ADX, as
shown in the following example.
NOTE
The state can be either UP or SUSPECT, depending on the state of the real server ports that are
bound to track-group ports. The track-group state is never in a DOWN state.
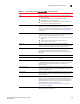
Unsuccessful Number of packets that were dropped for one of the following reasons:
• A deny filter configured on the Brocade Virtual ADX matched the
packet, causing the Brocade Virtual ADX to drop the packet.
• A client requested a TCP/UDP port that is not bound on the VIP.
last conn rate Rate of TCP traffic per second. This counter includes all TCP traffic,
including TCP SYN DoS attacks.
max conn rate Peak rate of TCP traffic (per second) encountered on this device
last TCP attack rate Rate of TCP Dos attacks per second. This rate is delayed by 1 to 2
minutes. This field displays in releases 09.0.00S and later.
max TCP attack rate Peak rate of TCP DoS attacks (per second) encountered on this device.
This rate is delayed by 1 to 2 minutes.
TABLE 45 Field descriptions for the show server traffic command (Continued)
Field Description
Virtual ADX#show track-group-state
Virtual Server track-group state
v1 80 3030 21 SUSPECT
v2 443 80 UP
v3 80 443 SUSPECT