
Administrators Guide (Supporting Fabric OS v7.3.0) Manual


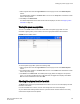

If the switch status is marginal or critical, information on the trigger that caused that status displays in
the Switch Information view.
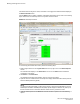
Click the Status button to display a detailed, customizable switch status report, shown in the following
figure. Note that this is a static report and not a dynamic view of the switch.
FIGURE 31 Switch Report window
To check the physical health of the switch, perform the following steps.
1. Select a logical switch from the Logical Switch list in the top-right corner of the Switch Explorer
window.
The selected switch displays in the Switch View. The icon on the Status button indicates the
overall status of the switch.
2. Click Status on the Switch View.
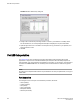
The detailed switch health report displays, as shown in the previous figure.
3. Optional: Click the underlined links in the left panel to display detailed information about ports and
Switch Availability Monitoring (SAM).
NOTE
You must have the Fabric Watch or Fabric Vision license to view the Port Detail Report. The Port
Detail Report and Switch Availability Monitor (SAM) reports display the details of only those ports
that are members of the current Admin Domain context and the E_Ports of the switch.
4. Optional: Hold the pointer on the Action bar and click an action to perform one of the following
options:
Working with Diagnostic Features
164 Web Tools Administrator's Guide
53-1003169-01