
Install Instructions


103448-08 - 9/16 103
X. Operation E. Boiler Sequence Of Operation (continued)
3. Status Screens (continued)
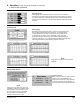
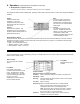
Data Logging
Real time graphic trends allow users to observe process changes over
time providing valuable diagnostic information. For example, ame
current performance over start up periods and varying loads can be
an indication of gas supply issues. Additionally, supply and return
temperature dual pen trends brings a focused look at heat exchanger
and pump performance. For example, studying a differential temperature
trend may indicate pump speed settings need to be changed.
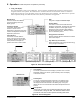
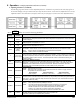
Bargraph Screen
Bargraph Screen
The bargraph screen presents measured values for easy comparison.
Included on this screen is ring rate and when the Zone Panel is connected
the measure Heat Loss. Measured heat loss is the heat rate kbtu/hr sum of
all active (call for heat) zones. This value represents the maximum required
ring rate.
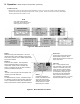
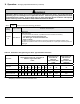
Trend Screens
NOTE
Firing Rate Trend shows fan demand and
feedback.
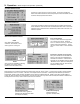
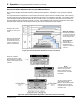
Burner Status Screen
Cycles and Hours
Boiler cycles and hours are used to monitor
the boilers overall compatibility to the
heating load. Excessive cycling compared
to run time house may be an indication of
pumping, boiler sizing or adjustment issues.
NOTE
“Boiler Cycle” and “Run Time Hours” are
resettable by selecting the “Reset Counts”
button located on the information screen.
The “Controller Cycles” and “Controller
Run Time” data is not resettable and
remains for the life of the control.