Titlepage SmartSwitch 9000/9500 Series Supports Multiple Management Modules Device Management
Copyright Notice Document 1443. Copyright © 2002-present by Aprisma Management Technologies, Inc. All rights reserved worldwide. Use, duplication, or disclosure by the United States government is subject to the restrictions set forth in DFARS 252.227-7013(c)(1)(ii) and FAR 52.227-19. Liability Disclaimer Aprisma Management Technologies, Inc. (“Aprisma”) reserves the right to make changes in specifications and other information contained in this document without prior notice.
Contents INTRODUCTION Interface Icon Subviews Menu Selections ............. 23 Secondary Address Panel ............................................ 23 Chassis Device View................................................. 24 Chassis Module Icon ............................................. 26 Module Identification Labels............................... 26 Interface Labels.................................................. 26 Chassis Module Icon Subviews Menu Selections .........................................
Contents DEVICE TOPOLOGY VIEW Contents FDDI Port Label Icon Subviews Menu Selections .... 56 FddiMAC Device Configuration View ........................... 56 Station Configuration ......................................... 56 SMT Information ................................................ 58 FDDI Port Configuration View ...................................... 58 Port Management .............................................. 58 Repeater Configuration View .......................................
Contents Contents Interface Configuration Table View ............................ 100 Interface Statistics Table View ................................... 101 Connection Configuration Table View ........................ 101 Connection Statistics Table ........................................ 102 Queue Configuration Table View ............................... 103 Queue Statistics Table View ...................................... 104 CTM Interface Configuration Table View ...................
Contents Contents Virtual Channel Link Table View..............................125 Virtual Path Link Table View....................................126 Traffic Parameter Table View .....................................127 ILMI Network Prefix Table View ..................................128 VCL Statistics Table View ...........................................129 Switched Virtual Channel Cross Connect Table View ...........................................................129 Signalling Monitoring Table View .
Introduction This section introduces the SPECTRUM Device Management documentation for the SmartSwitch 9000/9500 Series of devices manufactured by Cabletron. This introduction contains the following topics: • Purpose and Scope SPECTRUM and explanations of SPECTRUM functionality and navigation techniques, refer to the topics listed under Required Reading.
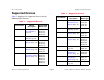
Introduction Supported Devices Supported Devices Table 1: Supported Devices Table 1 displays the supported devices for the SS9000/9500 chassis.
Introduction Supported Devices Table 1: Supported Devices Part Number Module Description SPECTRUM Model Type SM-CSI1098 Dual INB Modules (Page 12) 9H5xx 9G5xx 9E5xx SM-CSI1100 Generic 9000 Module Gen9000 The SmartSwitch 9000/9500 Series consists of a 6 and 14 module chassis, an Environmental module, a Flexible Network Bus (FNB), a high speed Internal Network Bus (INB), and over 30 different types of modules.
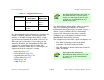
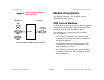
Introduction Figure 1: Module Descriptions Front Panel/Backplane Relationship Module Descriptions The following modules are available for the SmartSwitch 9000 Series: Backplane Front Panel ATM Access Modules INB 1 Interface Connection 2 Module FNB1 An ATM Access module is a device that is capable of providing connectivity between FDDI or ATM networks and the INB, the FNB or both.
Introduction Module Descriptions Ethernet MicroLAN Switch Modules Ethernet SmartSwitch INB 2 Modules The Ethernet MicroLAN Switch Module is a four channel Ethernet to FDDI bridge. Up to three front panel Ethernet networks can be connected to this module. These networks can be bridged to any other Ethernet or FDDI segment, and to any other MMAC-Plus card via the FNB bus.
Introduction Module Descriptions Dual INB Modules Dual INB Modules make use of both INB 1 and INB 2 backplanes. When a Dual INB board is inserted into the backplane, the chassis makes a determination as to which backplane it will attach to. This is done by checking the loads on both INBs and the INB with the least amount of traffic will be the one the board communicates with. The speed at which the backplane is running will depend upon the speed of the slowest board.
Introduction Module Descriptions • The 9H539-24 is a high-performance Fast Ethernet module for the SmartSwitch 9000 providing 24 100Base-FX ports via SMF Mini MTRJ connectors. • The 9H422-12 module provides 11 fixed RJ45 connections for category 5 twisted pair, and one media-flexible interface to accept either an additional RJ-45 or a MMF or single-mode fiber SC interface via the Fast Ethernet Port Interface Module.
Introduction Module Descriptions FDDI SmartSwitch Modules FDDI MicroLAN Modules The FDDI SmartSwitch Module (9F310-02, 9F426-02 and 9F426-03) connects two external FDDI networks to a high speed switching backplane, the INB. The external FDDI networks connect to the FDDI SmartSwitch Module using standard FDDI Dual Attached Station (DAS) A/B ports. The FDDI MicroLAN Modules are a family of concentrators providing eight or twelve master ports for connections to a Single or Dual Attached Station.
Introduction Module Descriptions Gigabit Ethernet SmartSwitch Modules interconnect across the chassis’s FNB, a dual 100 Mbps FDDI backplane, and can be configured for FNB-1 or FNB-2. The Gigabit Ethernet SmartSwitch Modules (9G426-02, 9G421-02, and 9G429-02) are single slot devices that connect to the INB backplane to integrate connectivity to ATM, FDDI, and Fast Ethernet.
Introduction Module Descriptions SmartCell Switches Carrier Module The SmartCell switch module (9A656-04 and 9A686-04) is a single-slot, hot-swappable module for the SmartSwitch 9000. Each module provides 4.5 Gbps of ATM Switching fabric with 64K cell output buffers that provide priority queuing and the ability to communicate with other SmartCell switches via a unique Cell Transfer Matrix (CTM) backplane. The 9M426-02 Carrier Module for the SmartSwitch 9000 combines voice, video, and data.
Introduction The SPECTRUM Model The SPECTRUM Model The model types for the Cabletron devices appear in Table 1 (Page 8). The rest of the documentation for these management modules is organized according to view type, as follows. Modeling results in the creation of Device icons that represent the devices and Application icons that represent their supported applications.
Tasks This section identifies various management and troubleshooting tasks that can be performed for the SmartSwitch 9000/9500 using the views, icons, and label referenced within this document.
Tasks The SPECTRUM Model • Port Configuration - CSIIf Port View (Page 49) • Interface Device View (Page 20) Setting Repeater Traps and Alarms • Trap Configuration (Page 60) • Alarm Configuration (Page 61) Setting Ring Alarms and Thresholds • TR Ring Configuration View (Page 70) • Token Ring Security Configuration View (Page 72) • Configure Station Alarms (Page 81) • Station Alarms Dialog Box (Page 82) Setting Token Ring Security • Modify Allowed Station List View (Page 85) Device Management Page 19
Device View This section describes the Device view and subviews available for models of Cabletron devices in SPECTRUM. Device Views Interface Device View These views display icons and labels that represent the device, its ports or interfaces, and its applications. SmartSwitch 9000 devices support two types of device views: Access: From the Icon Subviews for the a SmartSwitch 9000/9500 icon, select Device > Interface.
Device View Figure 3: Device Views Interface Device View Interface Icons Figure 4 shows a close-up of an Interface icon from an Interface Device view. Most of the informational labels on the icon also provide double-click access to other views, as explained in the following label descriptions. Figure 4: Interface Icon ATM Interface (a) (b) ON e1 ethernet 0:0:1D:17:2F:3C 0.0.0.
Device View Device Views Interface Number Label This label displays the number identifying this interface. The first number represents the slot that this module resides in. The second number represents the interface number on this module. Table 3: Color Interface Status Label This label displays the current Operational Status of the interface. It also provides double-click access to the Port Configuration - CSIIf Port View (Page 49).
Device View Secondary Address Panel corresponding row for the IF Address Translation table, but allows you to modify field values. Table 4: IP Address Label This label displays the IP address for the interface. Double-click this label to open the Secondary Address Panel (Page 23), which lets you change the address and mask for the interface.
Device View Secondary Address Panel Chassis Device View Figure 5: Access: From the Icon Subviews for the Device icon of the SmartSwitch 9000/9500, select Device > Chassis. Figure 5 is common to all devices available within the SmartSwitch 9000 and displays the Module Icon that represents the Physical Devices and their placement in the chassis. These Module icons vary depending upon the device and are explained in their appropriate technology section.
Device View Secondary Address Panel Figure 6: Ethernet Chassis Module Icon Configuration Views Module Identification Labels 8 9E132-15 Model Name Bridging Repeater Labels Repeater Port Labels Port Number Label Port Status Label Packet Rate Label Device Management fnb e1 e2 e3 Slot Number Model Type Model Name Application Access Label FWD FWD FWD Interface Labels FWD Interface Type and Number Interface Status E1 UNLOCKED E2 UNLOCKED E3 UNLOCKED 1 ON Pkts 4 2 ON Pkts 4 3 ON Pkts 4 Page
Device View Chassis Module Icon Figure 6 displays a logical representation of the physical module icon, its location in the chassis, and its front panel interfaces or ports. Note: Note: The Chassis Module icon representing each device will have no basic components. Some devices may have different labels depending on the application running, front panel interfaces, and device type.
Device View Secondary Address Panel FNB Backplane View Chassis Module Icon Subviews Menu Selections Access: From the Chassis or Backplane Device View, click on the FNB button. Table 5 lists each of the Icon Subviews menus common to the Chassis Module for each device within the SmartSwitch 9000 chassis. These views are described in SPECTRUM Views. A summary and example for each view is provided within this section.
Device View Secondary Address Panel Figure 7: FNB Backplane View Table 6 lists the Icon Subviews menu for the FNB Backplane. Model Name of type 9E133-36 of Landscape VNMHost: Primary File View Tools Bookmark Help Net Addr Model Name Manufacturer Description Device Type Location Serial Number 1 9F120-08 Refresh 4 8 5 8 9E133-36 9H423-26 Apply FNB Backplane Icon Subviews Menu Selections Options Sys Up Time Contact Primary Ring Secondary Ring Table 6: Opens the...
Device View Secondary Address Panel Backplane Device View Figure 8: Access: From the Chassis, Environmental, or Physical view, select View > Page > Backplane. Backplane Device View Model Name of type 9E133-36 of Landscape VNMHost: Primary File Figure 8 shows a logical representation of the backplane connections (FNB, INB and SMB) for each of the modules installed in the chassis. An example of a backplane icon, its double-click zones and Icon Subviews menus is discussed in the following pages.
Device View Figure 9: Secondary Address Panel Backplane Module Icon Module Identification Labels Slot Number Model Type Model Name 8 9A656-04 This icon displays a logical representation of the physical module, its location in the chassis, its backplane interfaces and its ports. Figure 9 shows an example of the Backplane Module icon.
Device View Secondary Address Panel SMB 1 and SMB 10 Icons FNB 1 and FNB 2 Icons The System Management Bus (SMB) icons represent the connections between the module and the SMB 1 and SMB 10. Table 7 describes the possible operational states. The Flexible Network Bus (FNB) icons (see Figure 9 on Page 30) represent the connections between the module and the FNB 1 and FNB 2. Table 8 describes the possible operational states.
Device View Table 8: Color Secondary Address Panel FNB 1 and FNB 2 Status Descriptions Status Table 9: Description Color Blue --- The module is not connected to the FNB but has the potential to be connected. Blue DIS The module is disabled. Yellow CON The module is in the process of connecting to the FNB. Green ACT The module is connected to the FNB and is active. Red SBY The module is in standby mode.
Device View Secondary Address Panel Environmental Device View Figure 10: Environmental Device View Access: From the Chassis, Backplane, or Physical view, select View > Page > Environmental. SpectroGRAPH: Device: Model Name This view displays the temperature in Fahrenheit or Celsius (selectable from the Options menu) and power levels for the devices installed in the chassis. Figure 10 shows an example of an Environmental Device view.
Device View Secondary Address Panel Chassis Environmental Information This area of the Device view also indicates the environmental status of the chassis. These panels and their fields are as follows: Power Subsystem • Total - displays the maximum power that could be supplied by the chassis power supply. • Used - displays the total power currently being supplied by the chassis power supply. Climate • Temp - displays the ambient temperature of the room in which the chassis is located.
Device View - Secondary Address Panel Yellow - over current, over voltage, or under voltage. • Diag Pwr Bus - field does not function at this time. A future version of firmware will include this functionality. This view provides the following information on the UPS battery. Index An unique value that identifies a particular UPS. UPS/Battery • Status - displays the UPS’s operational status. Below are a list of colors and conditions associated with this field. - Name The name of the UPS.
Device View Secondary Address Panel UPS Configuration Information View Status Access: By double clicking on an entry in the UPS Detail view. The Status section of the UPS Configuration Information view displays information on the operational and fault status of a particular UPS. This view displays information on the condition, status and the input/output power of a particular UPS.
Device View Secondary Address Panel Voltage The UPS’s present battery voltage. You can determine the actual voltage by dividing the value of the field by 100. Input Voltage The UPS’s measured utility input voltage. The value is determined by dividing the value of the field by 10. Run Time Remaining (min) The UPS’s estimated remaining run time (in minutes). The UPS can be queried when operating in on-line, bypass, or on-battery modes.
Device View Secondary Address Panel Figure 11: Environmental Module Chassis Device View Primary Landscape 0x00400000 File View Tools Bookmark Network Address Model Name Sys Up Time Contact Manufacturer Description Device Type Location Primary Application Serial Number Status COM 1: COM 2: FNB COM ports 1 and 2 are RS232 serial ports providing out-of-band management.
Device View Secondary Address Panel Physical Device View Access: From the Chassis, Environmental, or Backplane view, select View > Page > Physical. This view (Figure 12) provides a static image of the chassis, ports, and modules installed in the chassis.
Device Topology View This section describes the Device Topology view available for models of Cabletron devices. Device Topology View Figure 13: Access: From the Icon Subviews for the Device icon, select DevTop. Device Topology View Primary Landscape 0x00400000 - VNM Host - 9E133_08 of type 9E133_08 View File Figure 13 displays icons that represent the device, its ports or interfaces, and the devices and LAN networks that contain those devices connected to its ports. It is described in SPECTRUM Views.
Application Views This section describes the main Application view and the associated application-specific subviews available for models of Cabletron devices in SPECTRUM. Figure 14: Main Application View Access: From the Icon Subviews menu for the Device icon, select Application.
Application Views Common Applications Common Applications - For the most part, these applications represent the non proprietary MIBs supported by your device. Listed below (beneath the title of the SPECTRUM document that describes them) are some of the common applications currently supported by SPECTRUM. • MIB II Applications - SNMP - IP - ICMP - TCP - System2 - UDP The documents listed below (in bold font) are available for viewing at: Note: Note: www.aprisma.
Application Views Chassis Application View • Technology Applications - APPN - ATM Client - DHCP - DLSw - PNNI - RFC 1316App - RFC 1514 - RFC 2287 - RFC 2790 - RFC 2925 Note: Note: Aprisma Management Technologies can provide training, technical assistance, and custom engineering support services for creating application models and their associated views. For information on the following optional applications, refer to the associated documentation.
Application Views Figure 15: Chassis Application View Chassis Application View SpectroGRAPH: Application: 9CX14 File View Tools Help Bookmark Network Address Model Name- System Up Time Contact Manufacturer Description Device Type Location Serial Number Container View Access: From the Icon Subviews for the Chassis Icon, select Container. Figure 16 displays Location view icons for each module installed in the SmartSwitch 9000 chassis.
Application Views Chassis Application View Module View Figure 17: Access: From the Icon Subviews for the Chassis icon, select Module View. Module View Model Name of type SmartSwitch 9000 of Landscape VNMHost: Primary File View Tools Bookmark Figure 17 displays Location view icons for each module installed in the chassis. Rows list the slot, model type, network address, and community string.
Performance Views This section provides brief descriptions of the Performance views available for the Cabletron devices in SPECTRUM. Performance views display performance statistics in terms of a set of transmission attributes, e.g., cell rates, frame rates, % error, etc. A typical view is shown in Figure 18. The instantaneous condition of each transmission attribute is recorded in a graph. The statistical information for each attribute is presented in the adjacent table.
Configuration Views This section describes the various Configuration views available for models of the Cabletron devices in SPECTRUM. Configuration Views Figure 19: Figure 19 is an example of a Device Configuration View, which, along with the Port Configuration View also explained in this section, is common to most of the devices contained within the SmartSwitch 9000.
Configuration Views Device Configuration View Device Configuration View Reconfigure Interfaces Access: From the Icon Subviews menu the SmartSwitch 6000 Device icon, select Configuration. This button updates the interfaces displayed in SPECTRUM to reflect any changes. This view (Figure 19 on Page 47) provides status and configuration information about the device as a whole as well as on a port-by-port basis.
Configuration Views Device Configuration View Port Configuration - CSIIf Port View Access: From the Icon Subviews menu for a specific interface label within a Chassis Module Icon, select CSIIF Port. This view displays port-specific information for the device. Interface Index The numerical value identifying the port. Interface Type The type of interface for the port (FDDI). Operation Status The current operating state of the port. Possible values are: On, Off, and Test.
Model Information View This section provides a brief overview of the Model Information view. Model Information View Figure 20: Access: From the Icon Subviews for the Device icon, select Model Information. Model Information View Model Name of type 9E133_08 of Landscape VNMHost: Primary View File Figure 20 displays information about this device and allows you to set thresholds and alarm severity. This view may vary depending on the model it defines.
FDDI This section provides a table of all the FDDI model types, the FDDI Chassis Icons associated with these model types, and general descriptions of the views that are available for the devices represented by these model types. Overview Below is a bulleted list of the main FDDI views for the SmartSwitch 9000, and a brief description of each. Table 10 represents all the FDDI Devices available for the SmartSwitch 9000.
FDDI Overview Table 10: Device FDDI Model Types Model Type 9F116-01 FDDI Switch Module 9F116-01 9F120-08 MicroLAN Concentrator 9F120-08 9F125-08 MicroLAN Concentrator 9F125-08 9F122-12 MicroLAN Concentrator 9F122-12 9F241-12 Concentrator Module-Dual Attached 9F241-12 9F310-02 FDDI SmartSwitch Module 9F310-02 9F426-02 FDDI SmartSwitch Module 9F426-02 9F426-03 FDDI SmartSwitch Module 9F426-03 Device Management Page 52 Example Device Icon Model Name Model Name 9F426_02 9F426_02 Smart
FDDI Overview Figure 21: FDDI Chassis Module Icon Module Identification Labels 8 9F120-08 Model Name FDDI 1 FDDI Port Labels Port Number Label Port Status Label 1 2 3 4 5 6 7 8 9 10 11 12 ACT Device Management 8 9F426-02 Model Name Application Access Label Bridging CON CON CON Interface Labels Interface Type and Number Interface Status CON i2 FWD f1 FWD f2 FWD Configuration Views FDDI 1 CON CON FDDI Ring Labels CON (with Ring Number) CON CON FDDI Port Labels CON Ring Identific
FDDI Overview FDDI Interface Label Icon Subviews Menu Options Table 12: Repeater Port Status and Conditions Values and Colors Table 11 describes each of the device-specific Icon Subviews menu selections available for the Interface Label. Table 11: Color Interface Label Icon Subviews Menu Options Status Description Green ON Port is operational. Blue OFF Port is off. Yellow TST Port is in the test mode. Opens the... Configuration Opens the Port Configuration - CSIIf Port View (Page 49).
FDDI Overview FDDI Ring Label Icon Subviews Menu Options FDDI Port Labels Table 13 describes each of the device-specific Icon Subviews menu selections available for the FDDI Ring Label. Table 13: FDDI Icon Subviews Menu Options Opens the... FDDI Performance Performance Views (Page 46). (Not available for FddiNoMAC.) FDDI Configuration FddiMAC Device Configuration View on Page 56. FDDI Station List FDDI Station Table View on Page 62. (Not available for FddiNoMAC.
FDDI FddiMAC Device Configuration View FDDI Port Label Icon Subviews Menu Selections Station Configuration Table 15 describes each of the device-specific Icon Subviews menu selections available for the FDDI Port Label. Table 15: FDDI Port Icon Subviews Menu Options This area of the FddiMAC Device Configuration view provides information specific to the FDDI station: Ring State The current state of the FDDI Ring. Table 16 lists the possible states and their descriptions. Table 16: Opens the...
FDDI FddiMAC Device Configuration View Table 16: Directed Trace FDDI Ring States (Continued) Table 17: The claim/beacon process did not complete within 9 seconds. The concentrator is now sending directed beacons to indicate a problem. A problem has been detected with the station or its upstream neighbor. A trace is being sent to notify the upstream neighbor of the problem. The concentrator and all stations between the concentrator and its upstream neighbor can perform self-tests.
FDDI FDDI Port Configuration View Current MAC Path The ring that this station resides on. Possible entries are: Primary, Secondary, Local, or Isolated. T-Notify (sec) The timer value, in seconds, used in Neighbor Notification Protocol. The allowed range is from 2 to 30 seconds. MAC Address The MAC (physical) address of this station. T-Req (milli sec) The Target Token Rotation Time (TTRT) bid, in milliseconds, made by this concentrator. MAC Count The number of MACs supported by this station.
FDDI FDDI Port Configuration View “Other” once the port has been Enabled/Disabled. Figure 22: Link Estimate Table Port State The status of this port. Possible states are: disabled, connecting, standby, and active. Bit Errors per Second Port Type The type of port. Possible port types are: A_Port, B_Port, Slave, or Master. Link Error Rate Estimate The link error rate estimate is a cumulative longterm average of the bit error rate, which represents the quality of the physical link.
FDDI Repeater Configuration View Link Error Rate Alarm The link error rate threshold that, if exceeded, generates an alarm for the port. The default link error rate alarm threshold is 8, which represents 1.25 bit errors per second. Ports On The total number of ports currently in the ON state on this network. Ports Operational The number of operational ports on this network. Link Error Monitor Reject Count The link error monitor count of the times the link has been rejected.
FDDI Repeater Configuration View Link Traps When enabled, all packets indicating a change in link status are reported within the trap database. Valid values are: NoEnable, Enable, or other. Segmentation Traps When enabled, all packets indicating a change in segmentation status are reported within the trap database. Valid values are: NoEnable, Enable, or other. Source Address Traps When enabled, all packets indicating a change in source address are reported within the trap database.
FDDI FDDI Station Table View Error Threshold The threshold value within the alarm timebase that, once the percentage of errors per good packet is exceeded, generates an error alarm. No_Resource The number of times the module ran out of resources (i.e., lack of buffer space) and could not accept packets. Error Source Giants The number of giant packets received by the module. A giant packet exceeds 1518 bytes (not including preamble).
FDDI FDDI Stats View Station Address The MAC or Canonical address of this node on the ring. Node Class The type of FDDI ring device. Table 18 describes possible node classes. Table 18: Fddi Frames (Frm/Sec) The number of FDDI frames per second for the device. Description Station An FDDI node capable of receiving, transmitting, and repeating data. Concentrator An FDDI node that provides attachment points for stations that are not directly connected to the FDDI ring.
Token Ring This section provides a table of all the Token RIng model types, the Token Ring Chassis icons associated with these model types and general descriptions of the views that are available for the devices represented by these model types. Overview Below is a bulleted list of the main Token Ring views for the SmartSwitch 9000, and a brief description of each. Table 19 displays all the Token Ring Devices available for the SmartSwitch 9000.
Token Ring Overview Table 19: Device Token Ring Model Types Device Type 9T122-08 MicroLAN Switch Extension Module 9T122-08 9T122-24 MicroLAN Switch Module 9T122-24 9T125-08 MicroLAN Switch Module 9T125-08 9T125-24 MicroLAN Switch Extension Module 9T125-24 9T425-16 Token Ring SmartSwitch Module (dual slot) 9T425-16 9T427-16 Token Ring SmartSwitch Module (single slot) 9T427-16 9T428-16 Token Ring SmartSwitch Module (dual slot) 9T428-16 Device Management Page 65 Example Device Icon Model N
Token Ring Overview Figure 23: Example Token Ring Chassis Module Icon Module Identification Labels 8 9T122-08 Model Name Bridging Token Ring Label Icon Subviews Menu Selections FWD f2 FWD T1 16M T2 16M Application Access Label Interface Labels Interface Type and Number Interface Status Token Ring Labels (with Ring Number) 1 ENB 2 ENB 3 ENB 4 ENB Frms 0 RI RO ACT Frms 0 Ring Speed Label Frms 0 Token Ring Port Labels Frms 0 Port Number Label Port Status Label Frame Rate Label ACT Ri
Token Ring Overview Token Ring Label Ring Speed Label Figure 23 represents the Token Ring connection and displays the ring number it represents. Double-click this label to access the Token Ring Configuration View (Page 69). The speed this ring is configured to operate at (4M or 16M). Double-click on this area to open the Change Ring Speed view for the selected ring. This view allows you to set the desired ring speed.
Token Ring Overview Frame Rate Label The frame traffic rate over this port. Double-click on this area to open the Token Ring Station Detail View (Page 80). Options Port Notes Ring In/Ring Out and Ring Status Labels These labels displays the operational status of the Ring In and the Ring Out. Token Ring Port Icon Subviews Menu Options Table 22: Token Ring Port Icon Subviews Menu Selections Opens the... Port Notes view, which allows you to attach notes to port view.
Token Ring Token Ring Configuration View Token Ring Configuration View Ring Security Access: Within the Application view, highlight the CsTRApp and from the Icon Subviews menu, select Configuration, This view provides information on the configuration of the Token Ring application. Ring Speed The speed of the ring, which has a value of 4 or 16 megabits. Ring Status The operational state of the ring. Ring Configuration Opens the TR Ring Configuration View (Page 70).
Token Ring Token Ring Configuration View Host Configuration TR Ring Configuration View This section of the Token Ring Configuration view provides the following information: Access: In the Token Ring Configuration view, click the Ring Configuration button. Commands Allows you to send commands to the device. Possible commands are: HardwareReset, SoftwareReset, Open, and Close. The default value is NoOperation. This view provides configuration information on the ring to which the ports are attached.
Token Ring Token Ring Configuration View Active Stations The number of active stations currently inserted on the ring. Beacon Recovery Provides a button, allowing you to Enable or Disable automatic beacon recovery for the TR MicroLAN Switch Module. When Disabled, the TR MicroLAN Switch Module will not attempt to reinsert itself into the ring after entering a beaconing state. If the device does not support automatic beacon recovery, SPECTRUM will display a status of “Invalid”.
Token Ring Token Ring Configuration View Token Ring Security Configuration View Table 23: Administration States State Access: From the Token Ring Configuration views, click the Ring Security button. This view provides information on the security configuration for the ring. Ring Name The ASCII name assigned to this ring. This name defaults to Network n, where n is a unique integer value. Description EnabledWithAlarm Generates an alarm upon insertion of an illegal station into the ring.
Token Ring Update Allows you to update the contents of the Station Address Table. MAC/Canonical Affects the display of the station addresses, toggling the format between MAC (Physical) and Canonical. The button displays the format not currently selected. Set/Clear Filter Allows you to set a filter affecting the stations displayed in the table. You select an attribute to filter against by clicking one of the column heading buttons.
Token Ring Token Ring Station Table View Station Address The MAC address of the station to which this information pertains. MAC/Canonical This button affects the display of the station addressed, toggling between MAC (Physical) and Canonical (Token Ring). This button displays the format NOT currently selected. Station Name The ASCII name assigned to this station. Frames The total number of frames that have been received/generated by this station.
Token Ring Token Ring Station Table View Ring Number The number of the attached ring. If SPECTRUM cannot determine the number of the ring, a zero is returned. Station Detail Opens the Token Ring Station Detail View (Page 80). Ring Speed The speed of the ring, which can have a value of 4 or 16 megabits. Station Alarms Opens the Station Alarms Dialog Box (Page 82). Remove Station Allows you to remove the selected station from the ring.
Token Ring A/C The number of address/copied errors that this station has detected on the ring. Abort The number of abort sequences that this station has sent. Internal The number of internal errors that this station has detected. Token Ring Station Table View Canonical (Token Ring). This button displays the format NOT currently selected. Set Filter/Clear Filter Set Filter opens the Filter Dialog box for the selected column of the Station table. Type a character string to search the column.
Token Ring Token Ring Station Table View Ring Speed The speed of the ring, which can have a value of 4 or 16 megabits. Station Detail Opens the Token Ring Station Detail View (Page 80). Ring Status The operational state of the ring. Station Alarms Active Monitor The MAC address of the active monitor for the ring. This address will appear in any table with an asterisk (*) to identify it. Opens the Station Alarms Dialog Box (Page 82). Remove Station Removes the selected station from the ring.
Token Ring Token Ring Station Table View Token The number of token errors that this station has detected on the ring while it was acting as the active monitor. Set Filter/Clear Filter Set Filter opens the Filter Dialog box for the selected column of the Station table. Type a character string to search the column Frequency The number of frequency errors that this station has detected on the ring. Clear Filter returns the Station table to its normal state.
Token Ring Token Ring Station Table View Active Monitor The MAC address of the active monitor for the ring. This address will appear in any tables with an asterisk (*) to identify it. Station Alarms Opens the Station Alarms Dialog Box (Page 82). Remove Station Station Address The MAC address of the station to which this information pertains. Removes the selected station from the ring.
Token Ring Token Ring Station Table View MAC/Canonical This button affects the display of the station addressed, toggling between MAC (Physical) and Canonical (Token Ring). This button displays the format NOT currently selected. View (Page 79), but displays information on the state of each alarm threshold (Enabled or Disabled). Station Detail Opens the Token Ring Station Detail View.
Token Ring Token Ring Station Table View Station Port The number of the port on the token ring module to which this station is connected. Upstream The MAC address of the device (neighbor) immediately upstream of the station on the ring. Pie Charts Table 24 through Table 26 list the statistics and definitions for each of the pie charts displayed in this view. Table 24: Statistic Downstream The MAC address of the device (neighbor) immediately downstream of the station on the ring.
Token Ring Token Ring Station Table View Table 25: Non-Isolating Errors Pie Chart Statistic Table 26: Isolating Errors Pie Chart Definition Lost Frames The total number of times a station has had its Token Ring Rotation (TRR) timer expire trying to transmit. Congestions The total number of times a station recognizes a frame addressed to it, but the station has no available buffer space.
Token Ring Token Ring Station Table View Station The address of the current station. You can enter the address of a valid station in this field to make it the current station. clicking on an address in this list moves it to the Stations list. Alarm The threshold alarms that can be manipulated. The alarms in this column include: Line, Internal, Burst, A/C, and Congestion. Moves the selected item from the Stations list to the Apply Settings to list.
Token Ring Token Ring Station Table View 3 Read If the new alarm thresholds cannot be written to the device due to the device being down, an error message appears and you should try again later. Initiates a read of the threshold settings for the selected station or the station entered into the Station field. Reading Thresholds from a Station Cancel Exits the dialog box without applying settings to the stations or once you have applied all changes and wish to exit.
Token Ring Token Ring Station Table View is on the secure list. The device will place the station address on the Allowed Stations list. Modify Allowed Station List View Access: Within Token Ring Security Configuration view, click the Modify Allowed Station List button This view allows you to modify the security for the ring by adding or removing stations from the ring’s list of allowed stations. Caution Do not attempt to modify Ring Security without a complete understanding of Token Ring concepts.
Token Ring Token Ring Station Table View either the Allowed or Disallowed Station window by selecting the appropriate option in the ADD Station dialog box. A symbol (+) indicates that this station has recently been added, and will remain until the changes are applied. Selecting a recently added and still marked (+) station and clicking DELETE will remove it from the window. Stations window from the Disallowed Station window, and will remain until the changes are applied.
Token Ring Token Ring Station Table View will remain until the changes are applied, at which time the stations are actually removed from the window. This option will remove all station addresses except that belonging to the device itself. Selecting a station and clicking ADD will remove the symbol (-) and unmark that station for removal Changing the Ring Security State . If the new security state cannot be written to the device, a Cannot Update error message appears.
ATM This section provides a table of all ATM model types, the ATM Chassis icons associated with these model types, and general descriptions of the views that are available for the devices represented by these model types. Overview Below is a bulleted list of the main ATM views for the SmartSwitch 9000, and a brief description of each. For further details on ATM in see the ATM Ciruit Mangager Guide. Table 27 represents all the ATM Devices available for the SmartSwitch 9000.
ATM Overview • SFCS CTM Views (Page 104). These views provide detailed information for the CTM backplane contained within the device. • SFCS Bandwidth Management Views (Page 107). These views contain detailed information about bandwidth accessed and used by this device. Note: Note: The SFCS views are only accessible from the 9A656-04 and 9A686-04 models.
ATM Overview Table 27: Device ATM Model Types Model Type 9A000 Switch Module * 9A000 9A128-01 Access Module-FNB 9A128-01 9A426-01 Access Module-FNB and INB 9A426-01 9A426-02 Access Module-FNB and INB 9A426-02 9A656-04 SmartCell Switch 9A656-04 9A686-04 SmartCell Switch 9A686-04 Example Device Icon Model Name 9A128-01 Model Name 9A128-01 Model Name Model Name SFSmartCell SFSmartCell * The 9A000 was developed for Cabletron by Fore Systems and is discussed in the ForeRunner ATM Switch
ATM Overview Figure 24: Model Information View Module Identification Labels 14 9A686-04 Model Name Configuration Views ATM Chassis Module Icon Physical 401 402 403 Device Management Slot Number Model Type Model Name Application Access Label ON OFF ON Interface Labels Interface Type Model Information View 8 9A128-01 Model Name Bridging fnb atm FWD FWD Configuration Views Interface Status Page 91 SmartSwitch 9000/9500 Series
ATM ATM Client Application Configuration View ATM Client Application Configuration View Max VPI (Virtual Path Identifier) Bits The maximum number of active VPI bits configured for use at this ATM interface. At the UNI, the maximum number of active VPI bits configured for use ranges from 0 to 8. Access: Highlight the ATM Application Icon, and from the Icon Subviews, select ATM Configuration. This view provides configuration information on the ATM Client Application.
ATM ATM Interface Detail View HEC Errors The number of Header Error Control Errors. Neighbor Address The IP address of the neighbor system at the far end of this interface to which a Network Management Station can access network management information. Total The total number of cells. Neighbor If Name The name of the interface on the neighbor system at the far end of this interface, to which this interface connects.
ATM SFCS System Configuration View SFCS System Configuration View Table 28: Value Access: From the Icon Subviews for a SFCS Device icon, select SFCS System > Configuration. This view contains information used to set up and configure each Virtual Switch. It contains the following information: Admin Status Sets the administrative state of the Secure Fast Cell Switching (SFCS) services for this virtual switch. This controls the SFCS state at a chassis level.
ATM SFCS System Configuration View Max Stat Entries The maximum number of stats enabled VCs for this switch. PNNI Node Level The PNNI node level value. The range can be from 0 to 104. Max UPC Entries The maximum number of UPC enabled VCs for this switch. PNNI Addressing Mode The PNNI addressing mode. Possible modes are listed in Table 29. Firmware Version The Firmware Version of the switch.
ATM SFCS System Status View SFCS System Status View Access: From the Icon Subviews for a SFCS Device icon, select SFCS System > Status. This table contains the objects that pertain to the operational status of a Virtual Switch. It provides the following: TDM Cell Count The total number of cells being transferred across the Time Division Multiplexing (TDM) backplane for the entire switch. Current UPC Entries The current number of Usage Parameter Control (UPC) entries for this switch.
ATM Module Configuration Table View Module Configuration Table View SFCS MIB Version The current version, expressed as an integer, of the SFCS MIB for this switch module. Access: From the Icon Subviews for a SFCS Device icon, select SFCS Module > Configuration. SFCS MIB Rev The current revision level of the Cabletron SFCS MIB for this switch module. This table contains the configuration and administrative information for each SFCS module.
ATM Module Status Table View Curr Cnx Entries The current number of connection entries for this switch module. Number of ANIMS The number of ATM Network Interface Modules (ANIMs) currently configured on this switch module. Curr UPC Entries The current number of UPC entries for this switch module. BW Capability The total bandwidth capability for this switch engine, expressed in Mbps. Module Status Table View Curr Stats Entries The current number of statistics entries for this switch module.
ATM Statistics Engine Table View Oper Status The operational state of the SFCS module's UPC engine. Oper Time The amount of time that the SFCS switch statistics have been active for this switch module. Oper Time The amount of time that the UPC engine has been active for this switch module. Reset Resets the SFCS switch counters for this SFCS module. Writing a value of reset resets the SFCS switch counters to 0 and causes Oper Time to also be reset to “0.
ATM ANIM Status Table View Interface Configuration Table View ANIM Type The type of physical interface for this ANIM. Number of Ifs The number of operational interfaces for this ANIM. Access: From the Icon Subviews for a SFCS Device icon, select SFCS IF > Configuration. Line Rate The line rate per port, in Mbps, for this ANIM. This table contains the managed objects used to set up and configure each SFCS switching interface. ANIM Status Table View If Index The interface with which you are dealing.
ATM Interface Statistics Table View Interface Statistics Table View Access: From the Icon Subviews for a SFCS Device icon, select SFCS IF > Statistics. This table contains the objects that specify the packet and byte counters for each configured SFCS switching interface. It provides the following: Connection Configuration Table View Access: From the Icon Subviews for a SFCS Device icon, select SFCS Connections > Configuration.
ATM Connection Statistics Table High If Index The value of this object that is equal to the high MIB II IfIndex value of the ATM interface port for this cross-connect. Owner The owner of this cross-connect. Possible values are: other, own, and dontown. High VPI The value of this object that is equal to the high VPI value at the ATM interface associated with the cross-connect that is identified by Index. Connection Statistics Table This table contains the connection configuration information.
ATM Queue Configuration Table View CC High If Index The value of this object that is equal to the high MIB-II IfIndex value of the ATM interface port for this cross-connect. Hi to Lo Dropped Cells The High to Low dropped cell count for this connection. CC High VPI The value of this object that is equal to the high VPI value at the ATM interface associated with the cross-connect that is identified by Index.
ATM Queue Statistics Table View Clp Drop Threshold The queue level to start dropping cells with a Cell Loss Priority equal to one (CLP = 1). This level is expressed as the percentage of this queue's size. Congestion Threshold The level at which to consider this queue congested. This level is expressed as the percentage of this queue's size. RM Threshold The RM queue threshold expressed as a percentage of the queue's size.
ATM CTM Interface Statistics Table View Type Sets the type of interface access attribute for the SFCS interfaces. Possible attributes are described in Table 30. Table 30: SFCS Attribute Types Attribute Clocking To MB The ANIM clocking to source. Possible values are: generatedTransmitClock, channelRecoveredClock, systemMasterClock, and notSupported. Description accessPort Allow single user or shared access and perform statistics and control.
ATM CTM Queue Configuration Table View VPI Lookup Invalid Errs The number of VPI lookup invalid and out of range errors. Queue The index that identifies the transmit queue with which you are dealing. Rx Cnx Lookup Invalid Errs The number of receive connection lookup invalid errors. Size The size of the transmit queue. Allocated Rx BW The allocated receive bandwidth. Clp Drop Threshold The queue level to start dropping CLP=1 cells for this queue.
ATM CTM Queue Statistics Table View CTM Queue Statistics Table View BW Manager NIM Information Table View Access: From the Icon Subviews for a SFCS Device icon, select SFCS CTM > Queue Statistics. Access: From the Icon Subviews for a SFCS Device icon, select SFCS Bandwidth Manager > Nim Information. This view contains the statistics information for all queues on the SFCS. This table contains information about the administrative status of the Network Information Module (NIM).
ATM BW Manager Port Information Table View BW Manager Port Information Table View BW Manager Port Pool Limits Table View Access: From the Icon Subviews for a SFCS Device icon, select SFCS Bandwidth Manager > Port Pool Information. Access: From the Icon Subviews for a SFCS Device icon, select SFCS Bandwidth Manager > Port Pool Limits Information.
ATM BW Manager Port Pool Statistics Table View to be allocated. Possible values are listed in Table 31. Table 31: BW Allocated Formula Values Value 0 Access: From the Icon Subviews for a SFCS Device icon, select SFCS Bandwidth Manager > Port Pool Statistics. Description This table contains the following information: Conservative: Allocates the full amount of variable bandwidth. This is the default value. 1 Moderate: Allocates approximately half of the variable bandwidth.
ATM BW Manager Port Pool Trap Management Table View Avail Bw Fwd The current amount of available bandwidth in the forward direction. BW Manager Port Pool Trap Management Table View Avail Bw Rev The current amount of available bandwidth in the reverse direction. Access: From the Icon Subviews for a SFCS Device icon, select SFCS Bandwidth Manager > Port Pool Trap Management.
ATM BW Manager Port Pool Trap Management Table View Node Configuration Table View bandwidth to fall below this value, a trap is generated. Access: From the Icon Subviews menu for the PNNI Application icon, select Node Configuration. Rev Alloc Bw Lower The lower threshold for the Alloc BW rev trap. When an allocation causes a currently allocated bandwidth to fall below this value, a trap is generated. This view contains the following information: Index The numerical sequence of the node.
ATM BW Manager Port Pool Trap Management Table View PGL Election Information View NodeIintTime The number of seconds this node will delay advertising its choice of preferred PGL after having initialized operation and reaching the full state with at least one neighbor in the peer group. Access: From the Node Configuration Table View, select the PGL Election Information button. This view provides Peer Group Leader (PGL) election information for a PNNI node in the switching system.
ATM BW Manager Port Pool Trap Management Table View Table 32: ActiveParentID The ID being used by the PGL to represent this peer group at the next higher level of the hierarchy. If this node is at the highest level of the hierarchy or if no PGL has been elected, the value is all zeros.
ATM BW Manager Port Pool Trap Management Table View Node ATM Address The ATM End System Address of the originating node. Parent ATM Address When the originating node is a peer group leader, this indicates the ATM address of the parent LGN. If the originating node is not the peer group leader of its peer group, this attribute's value is set to (all) zero(s). Parent PGL Node ID When the originating node is a peer group leader, this identifies the node elected as peer group leader of the parent peer group.
ATM BW Manager Port Pool Trap Management Table View HelloInterval The initial value for the Hello timer, in seconds. In the absence of triggered Hellos, this node will send one Hello packet on each of its ports on this interval. Node Timer Information Opens the Nodal Timer Information View (Page 115). Svcc Variable Information Inactivity The value for the Hello inactivity factor that this node will use to determine when a neighbor has gone down. The default value is 5.
ATM BW Manager Port Pool Trap Management Table View RXInterval The number of seconds between retransmissions of unacknowledged database summary packets, PTSE request packets, and PNNI Topology State Packets (PTSP). The default value is 5. DlyActIntvl The minimum amount of time between transmissions of delayed PTSE acknowledgment packets, in units of 100 milliseconds. The default value is 10.
ATM Interface Views CallingIntegTime The time, in seconds, this node waits for an SVCC it initiated as the calling party to become fully established before giving up. The default value is 35. CalledIntegTime The time, in seconds, this node waits for an SVCC it decided to accept as the called party to become fully established before giving up and tearing it down. The default value is 50. TrafficDescIndex An index in the ATM Traffic Descriptor Parameter Table defined in RFC 1695.
ATM Interface Views ATM Interface Configuration View Access: From the Icon Subviews menu for the Switch Application icon, select Interface > Configuration. Max VPI Bits The maximum number of active VPI bits configured for use at the ATM interface. This view provides the following information on the local interface configuration parameters for each ATM interface or port. Max VCI Bits The maximum number of active VCI bits configured for use on the ATM interface. If Index The interface number.
ATM Interface Views Neighbor Address The IP address of the neighbor system connected to the far end of this interface to which an NMS can send SNMP messages. Neighbor If Name The textual name of the interface of the neighbor defined in the Neighbor Address field. TC Sublayer Table View Access: From the Icon Subviews menu for the Switch Application icon, select Interface > TC Sublayer. This view provides the following Transmission Convergence (TC) sublayer alarm and event information.
ATM Cross Connect Views DS3 PLCP Table View Cross Connect Views Access: From the Icon Subviews menu for the Switch Application icon, select Interface > DS3 PLCP. Table 34 lists the menu options and views available via the Cross Connect option on the Switch Application Icon Subviews menu. This view provides the following Physical Layer Convergence Protocol (PLCP) statistics information. Table 34: IF Index The interface number.
ATM Cross Connect Views Index A unique value identifying the VC cross connect. Low Index The index value for the ATM interface for this VC cross connect, which is numerically lower than the Index value of the other ATM interface. Low VPI The VPI value at the ATM interface associated with the VC cross connect that is identified by Low Index. Low VCI The VCI value at the ATM interface associated with the VC cross connect that is identified by Low Index.
ATM Cross Connect Views state was entered prior to the last re-initialization of the agent, the value is 0. Row Status The status of this entry in the Cross Connect Table. This is used to create new VCL cross connects that are created using the VCL Table, or to change and delete existing cross connects. Access: From the Icon Subviews menu for the Switch Application icon, select Cross Connect > Virtual Paths.
ATM Links Views L2H Last Change The value of Sys Up Time at the time this VP cross connect entered its current operational state in the low to high direction. If the current state was entered prior to the last re-initialization of the agent, the value is 0. H2L Last Change The value of Sys Up Time at the time this VP cross connect entered its current operational state in the high to low direction. If the current state was entered prior to the last re-initialization of the agent, the value is 0.
ATM Creating PVCs and PVPs Creating PVCs and PVPs 4 The procedures for creating a Permanent Virtual Channel (PVC) and Permanent Virtual Path (PVP) are identical. You accomplish both by using views accessible from the SwitchApp Icon Subviews menu, as described below. Basically, you use Virtual Channel views to create PVCs and Virtual Path views to create PVPs. The following procedure describes how to create a PVC. To create a PVP, use the Virtual Path views instead of the Virtual Channel views.
ATM Creating PVCs and PVPs The VC Cross Connect Table View (Page 120) displays. 12 Follow the instructions in this view to cross connect the two ports for which you defined links. Cross connecting establishes the PVC. Note: Note: You should return to the Virtual Channel Link Table view to ensure that the PVC has been set properly. Virtual Channel Link Table View Access: From the Icon Subviews menu for the Switch Application icon, select Links > Virtual Channels.
ATM Creating PVCs and PVPs Virtual Path Link Table View current state was entered prior to the last reinitialization of the agent, the value is 0. Rcv Descr Index The row in the ATM Traffic Descriptor Table that applies to the receive direction of this VCL. Xmit Descr Index The row of the ATM Traffic Descriptor Table that applies to the transmit direction of this VCL. Cross Connect Id Implemented only for a VCL that is cross connected to other VCLs that belong to the same VCC.
ATM Traffic Parameter Table View Traffic Parameter Table View current state was entered prior to the last reinitialization of the agent, the value is 0. Access: From the Icon Subviews menu for the Switch Application icon, select Traffic Parameter. Rcv Descr Index The row in the Traffic Parameter Table that applies to the receive direction of the VPL. This view lets you create and modify traffic parameters or descriptors using the instructions given in the view.
ATM ILMI Network Prefix Table View • 1 = Service Class A, Constant Bit Rate and is used for video and circuit emulation. • 2 = Service Class B, Variable Bit Rate and is used for video and audio. • 3 = Service Class C and is used for connection-oriented data transmission. • 4 = Service Class D and used for connectionless data transmission. An unspecified QoS (value 0) is used for “besteffort” traffic. Row Status Used to specify the state of the row in this table.
ATM VCL Statistics Table View VCL Statistics Table View Access: From the Icon Subviews menu for the Switch Application icon, select VCL Statistics. Total Cells Out The total number of valid ATM cells transmitted by this VCL. This includes both CLP=0 and CLP=1 cells. This table contains all statistics counters per VCL. It is used to monitor the usage of the VCL in terms of incoming cells and outgoing cells. Clp0 Cells Out The total number of valid ATM cells transmitted with CLP=0 by this VCL.
ATM Switched Virtual Channel Cross Connect Table View Low IF The value of this object is equal to the ifIndex value of the ATM interface port for this SVCC cross-connect. The term low implies that this ATM interface has the numerically lower ifIndex value than the other ATM interface identified in the same atmSvcVcCrossConnectEntry. Low VPI The value of this object is equal to the VPI value associated with the SVCC cross-connect at the ATM interface that is identified by atmSvcVcCrossConnectLowIfIndex.
ATM Signalling Monitoring Table View Signalling Monitoring Table View SSCOP Errored PDUs SSCOP Errored PDUs Counter. This counter counts the sum of the following errors: • Invalid PDUs. These are defined in SSCOP and consist of PDUs with an incorrect length (MAA-ERROR code U), an undefined PDU type code, or that are not 32-bit aligned. Access: From the Icon Subviews menu for the Switch Application icon, select Signalling Monitoring.
ATM Signalling Monitoring Table View values is received. See Table 36 for applicable cause values and meanings: Table 37: Resources Unavailable Cause Value Table 36: Routes Unavailable Cause Value Meaning Meaning 38 Network out of order. 41 Temporary failure. 1 Unallocated (unassigned) number. 45 No VPCI/VCI available. 2 No route to specified transit network. 47 Resource unavailable, unspecified. 3 No route to destination. 49 Quality of Service unavailable.
ATM Signalling Monitoring Table View Table 38: • RELEASE, RELEASE COMPLETE, ADD PARTY REJECT, and STATUS messages transmitted, that contain any of the Cause values listed below. Called Party Cause Value Meaning 17 User busy. 18 No user responding. 21 Call rejected. 22 Number changed. 23 User rejects all calls with calling line identification restriction (CLIR). 27 Destination out of order. 31 Normal, unspecified. 88 Incompatible destination. • Ignored messages.
ATM Signalling Monitoring Table View The following cause values are monitored by this counter. See Table 39 for applicable cause values and meanings. (Note: These cause values apply to both UNI3.0 and UNI3.1 unless otherwise stated): Table 39: Cause Value Message Errors Meaning Calling Party Number of Calling Party Events detected on this interface. This counter monitors error events that occur due to the originating user doing something wrong.
ATM Signalling Monitoring Table View Timer Expired Number of Timer Expiries detected on this interface. The Timer Expiries Counter provides a count of network timer expiries, and to some extent, host or switch timer expiries. The conditions for incrementing this counter are: • Expiry of any network timer • Receipt of a RELEASE or RELEASE COMPLETE message with Cause #102, 'recovery on timer expiry'. Restarts Number of Restart Activity errors detected on this interface.
ATM Signalling Monitoring Table View transmitted. See Table 38 for applicable cause values and meanings. • Message with invalid protocol discriminator • Message with errors in the call reference I.E. NOTE: For this counter, RELEASE COMPLETE messages that are a reply to a previous RELEASE message and contain the same cause value, are redundant (for counting purposes) and should not be counted.
ATM ATM Link Modeling Options ATM Link Modeling Options code values is transmitted. See Table 40 for applicable cause values and meanings. Timer Expired Number of Timer Expiries transmitted from this interface. The Timer Expiries Counter provides a count of network timer expiries, and to some extent, host or switch timer expiries. The conditions for incrementing this counter are: • Expiry of any network timer • Receipt of a RELEASE or RELEASE COMPLETE message with Cause #102, 'recovery on timer expiry'.
ATM ATM Link Modeling Options Below are detailed instructions on how to create and destroy VCL and VPL models. 8 You will see the VPL/VCL models after the reconfiguration is completed. Creating VPL/VCL Models 1 Model the device that contains the ATM application. 2 Proceed to the Application view and find the ATM application icon. 3 Right-click the icon and select ATM Link Modeling Options. You may select the Option Explanations button to display instructions on screen.
Ethernet This section provides a table of all the Ethernet models and their associated model types, and the Ethernet Chassis icons associated with these model types. Overview Table 41 represents all the Ethernet Devices available for the SmartSwitch 9000. An example of an Ethernet Chassis module icon and the views available from it can be found in Device View (Page 20).
Ethernet Overview Table 41: Device Ethernet Model Types Model Type 9E132-15 MicroLAN Switch Extension Module 9E132-15 9E133-36 MicroLAN Switch Module - TP 9E133-36 9E138-12/36 MicroLAN Switch Module - Fiber 9E138-12/36 Example Device Icon Model Name 9E133-36 Device Management Page 140 Model Name 9E133-36 SmartSwitch 9000/9500 Series
Ethernet Overview Table 41: Device Ethernet Model Types Model Type 9E106-06 Ethernet SmartSwitch Module 9E106-06 9E423-36 Ethernet SmartSwitch Module 9E423-36 9E428-12/30 Ethernet SmartSwitch Module 9E428-12/30 9E429-12/36 Ethernet SmartSwitch Module 9E428-12/36 9E531-24 Ethernet Dual INB 9E5xx 9H423-28 SmartSwitch 10/100 Module 9H423-28 9H421-12 Fast Ethernet SmartSwitch Module 9H421-12 9H422-12 Fast Ethernet SmartSwitch Module 9H422-12 9H429-12 Fast Ethernet SmartSwitch Module 9H429-1
Modeling Considerations Some conditions apply concerning the placement (modeling) of model types within SPECTRUM views. The following restrictions apply: • Ethernet devices can be modeled in the Universe Topology view or an 802.3 LAN Topology view Figure 26: SmartSwitch 9000 Topology Front Panel Interface LAN Icons • Token Ring devices can only be modeled in an 802.5 LAN Topology view 802.3 LAN • FDDI devices can only be modeled in an FDDI LAN Topology view 802.3 LAN 802.
Modeling Considerations Modeling Using the Model Type SmSwChasCont Modeling Using the Model Type SmSwChasCont Figure 27: Chassis Container SpectroGRAPH: Topology: Universe You can also model the modules in a Chassis Container using the model type SmSwChasCont. This is a container that is modeled in the Universe view to contain the devices in a given chassis. These devices must be manually modeled in the container or cut and pasted into the Topology view for this container.
Modeling Considerations Modeling Using the Model Type SmSwChasCont Table 42 lists the Icon Subviews menu available from the Chassis Container Device icon. These views are specific to using the SmSwChasCont model type and allow for a central place for all chassis information to be accessed. Table 42: Icon Subviews menu for Chassis Container Option Topology Accesses the... Opens the Topology View, which contains the SmartSwitch modules that the user has placed/modeled in the container.
Manual Modeling This section details how to manually model your network. Summary Modeling the SmartSwitch 9000 chassis manually in SPECTRUM involves modeling one of the modules contained within the chassis, locating the SmartSwitch 9000 Location icon in the Lost and Found View, creating a Room Location View and copying the SmartSwitch 9000 Location icon to the Room Location View. From the SmartSwitch 9000 Location View icon you can access the views available for the SmartSwitch 9000 Chassis.
Manual Modeling Modeling the Chassis Modeling the Chassis For the purpose of this chapter, the Topology Views are defined as follows: The SmartSwitch 9000 chassis is modeled indirectly using one of the modules it contains.
Manual Modeling Modeling the Chassis Table 43: SmartSwitch 9000 Module Identification Worksheet ChassisPosition Example Module Type 9F116-01 IP Address 192:168:123:45 MAC Address 00:00:12:34:56:78 1 2 3 4 5 6 7 8 9 10 11 12 13 14 Device Management Page 147 SmartSwitch 9000/9500 Series
Manual Modeling Modeling the Chassis Placing the Chassis Location Icon in the Location View The Chassis Location icon must be copied into a Room Location View to allow access to the views available from the Location icon. Create a Room Location View as follows: 1 2 3 9 a Select New View from the View menu. b Select Lost & Found from the New View menu. Copy the Chassis Location icon into the Room View as follows: a From the View menu select New View > Location.
Manual Modeling Modeling the Chassis Modeling the Modules in the Chassis 2 In the Topology view, model the modules that can be modeled at this level (from the worksheet) that are connected to the FNB (FNB1 or FNB2) you modeled in step 1. 3 Open the FDDI LAN Topology view and model the modules (from the worksheet) that must be modeled at this level (refer to the Modeling the Chassis (Page 146) section).
Manual Modeling Modeling the Flexible Network Bus (FNB) Modeling the Flexible Network Bus (FNB) Modeling the Modules Connected to the INB Model an FDDI LAN to represent the FNB (FNB1 or FNB2) as follows: When modules that are connected to the INB are modeled, the INB is represented by an INB icon. This icon will appear automatically when two or more models are created in SPECTRUM. Model each device using the New Model... or New Model By IP... options.
Manual Modeling Modeling the Modules Connected to the FNB Modeling the Modules Connected to the FNB e Some modules are modeled in the Topology view that contains the FDDI LAN, while others are modeled in the FDDI LAN Topology view (within the FDDI LAN model). The following modules must be modeled in a FDDI LAN Topology view: 2 • 9F120-08 • 9F122-12 • 9F125-08 Double-click the Topology Arrow on the FDDI LAN to open the FDDI Topology view.
Manual Modeling Building the FNB Ring in the FDDI LAN Topology View Building the FNB Ring in the FDDI LAN Topology View 3 From the Topology view, click the Topology Arrow on the FDDI LAN icon to open the FDDI LAN Topology view. The FNB ring displays the FDDI Media Access Controller (FddiMAC) models or GenFddiMAC models representing the connection to the FNB ring on the backplane. To model the ring automatically use the procedure described in the RingView for FDDI User’s Guide.
Known Anomalies This section describes any known anomalies affecting Smartswitch 9000/9500 series devices in SPECTRUM. Table 44: Known Anomalies: Smartswitch 9000/9500 Series Devices Description Solution For some SmartSwitch 9000 modules, error messages can appear when you try to save created entries within the Static Bridging application’s Static Bridging table.
Index Symbols < Button 83, 86 << Button 83 > Button 86 >> Button 83 Numerics 9A128_01 10 9A426_01 10 9A426_02 10 9A686-04 16 9E106 11 9E106_06 11 9E1132-15 11 9E133-36 11 9E138-12 11 9E138-36 11 9E312_12 11 9E423_24 11 9E423_36 11 9E423-24 13, 150 9E428_12 11 9E428_36 11 9E429_12 11 9E429_36 11 Device Management 9F116-01 14 9F120_08 14 9F120-08 151 9F122_12 14 9F122-12 151 9F125_08 14 9F125-08 151 9F241_12 14 9F241-12 151 9F310-02 14 9F426-02 14 9F426-03 14 9F426-08 150 9G421-02 15 9G426-02 15 9G429-02 15
Index Mac 58 Management Source 60 Neighbor 119 Source Traps 61 Translation 23 Admin Reset 94 Admin Status 49, 94, 97, 98, 99, 121, 122, 125, 126 Administration State 72 Administrative Status Bridging Application 22 Aging Interval 60 Alarm 83 Configuration 61 Link Error Rate 60 State 120 States Table Button 80 Table Button 69, 74, 76, 78 Alarms Broadcast 61 Collisions 61 Error 61 Traffic 61 Alignment 62 Allowed Station 85 Address Table 72 AMP Errors 71 ANIM Index 99, 100 ANIM Type 100 Device Management In
Index Chassis Environmental Information 34 Chassis Module Icon 26 Application 27 Application Display 27 Configuration 27 Interface 27 Model Information 27 Claim Token Errors 71 Claim/Beacon Process 56 Clear Filter Button 73 Climate 34 Close 70 Clp Drop Threshold 104 Cnx Table Size 94, 97 Collision Alarms 61 Threshold 61 Collisions Out of Window 62 Commands 70 Concentrator 63 Isolated 56 Configuration 117 ATM Interface 118 Configuration View 92 Address Type 92 Admin Address 92 Conf VCCs 92 Conf VPCs 92 Devi
Index E Enable 69, 71, 80, 83 With Alarm 85 With Remove and Alarm 85 Enable/Disable Ethernet Port (Admin Status) 49 FDDI Port 56 Token Ring Port 68 Enabled (ENB) 67 Engine Reset 99 Environmental Device View 40 Environmental Module 145 Environmental Module Information 37 ERCI Low Threshold 104 Error 60, 74, 81 Alarms 61 Monitor Count Link 59 Monitor Reject Count Link 60 Rate Alarm Link 60 Rate Cutoff Link 59 Rate Estimate Link 59 Report Timer 70 Source 62 Threshold 62 Device Management Index Ethernet Mic
Index H H2L Last Change 121, 123 H2L Oper Status 121, 122 Hardware Reset 70 HEC Errors 93 Hi to Lo Dropped Cells 103 Hi to Lo Tagged Cells 103 Hi to Lo Tx Cells 103 High If Index 102, 103 High Index 121, 122 High VCI 102, 103, 121 High VPI 102, 103, 121, 122 Host Configuration 70 Error Status 70 Host Ctrl ATM Address 97 Humidity 34 I Icon ATM Chassis Module 91 Backplane Module 30 Chassis Module 26 Ethernet Chassis Module 25 FDDI Chassis Module 53 Interface 21 Token Ring Chassis Module 66 Icon Subviews 51
Index Estimate 59 Traps 61 Links Views 123 Lo to Hi Dropped Cells 103 Lo to Hi Tagged Cells 103 Lo to Hi Tx Cells 103 Local A 57 AB 57 B 57 S 57 Logical FDDI Icon Subviews Menu Selections 55 Loss of Cell Delineation 119 Loss of Frame 120 Lost Frames 71, 77, 82 Low Index 121, 122 VCI 121 VPI 121, 122 Low If Index 101, 102 Low VCI 101, 102 Low VPI 101, 102 M MAC Address 22, 58 Label 21 Device Management Index Button 73 Configuration 57 Count 58 MAC Address 22 Mac Cnx Entries 94 MAC/Canonical 62 Main Pwr B
Index NotRemovable 81 Number of ANIMS 95 Number of Ifs 100 Number of Queues 100 O OBS Present 58 OCD Events 119 Open 70 Status 70 Oper Status 94, 97, 99 Oper Time 94, 97, 99 Operation Status 49 Operational Status 35, 125, 126 Optical Bypass Switch 58 Out of Window Collisions 62 Output Voltage 37 Overflow Dropped Cell Count 101 P Packets Giant 62 Runt 62 Param 127 Parent ID 113 Parent Index 112 Paste 148 Device Management Index Path Current MAC 58 Path Links 126 Paths 120, 123 Peak Level 104 Peer Group
Index Repeater Configuration View 60 Management 60 Repeater Labels 54 Reset 99 Ring Alarm 71 Configuration 70 Button 69 Name 69, 70, 72, 73, 75, 77, 79 Number 69, 70, 72, 73, 75, 77, 79 Operational 56 Port ON Out Of 69 Purges 71 Security Button 69 Speed 69, 70, 72, 73, 75, 77, 79 State 56, 71 Status 69, 70, 72, 73, 75, 77, 79 Threshold 71 Timebase 71 Topology 63 Ring Identification Label 55 Ring Speed 67 Ring Speed Label 67 Ring States FDDI 56 RingIn/Ring Out and Ring Status Labels 68 Ring-Op Dup 56 RingVi
Index Station Configuration 56 Station Detail View 68 Stats Enable 102 Stats Entries 98 Stats Table Counter Size 102 Status 34, 35 Administrative 21 SVC Support 114 SVCC Information 116 Svcc Variable Information 115 Switch Capacity 97 Switch Host Port 97 Switched Virtual Channel 116 Switched Virtual Channel Cross Connect Table 129 T Target Token Rotation Time 58 Tasks 18 TDM Cell Count 96, 98 TDM Utilization 96, 98 Temp 34 Threshold 83 Broadcast 61 Collision 61 Error 62 Traffic 61 Threshold Information 23
Index Button 73 UPC Enable 102 UPC Entries 96, 98 Update Button 73, 76, 78, 79 UPS Configuration Information View 36 UPS/Battery 35 Upstream 81 Upstream Neighbor 57, 63 Used 34 V Valid Transmission Time 58 VC Cross Connect 120 VCC 118 VCI 118, 125, 129 VCL Statistics Table 129 View Application 152 FDDI LAN Topology 146, 149, 152 Lost & Found 148 Room Location 148 Topology 146 Virtual Channel Links 125 Channels 120, 123 Paths 120, 123 Virtual Path Links 126 Voltage 37 Device Management Index VP Cross Con