SPECTRUM Enterprise Manager Device Management Titlepage Cabletron Ethernet Hubs Supports Management Module SM-CSI1000
Notice Restricted Rights Notice Aprisma Management Technologies, Inc. (Aprisma), reserves the right to make changes in specifications and other information contained in this document without prior notice. The reader should in all cases consult Aprisma to determine whether any such changes have been made. (Applicable to licenses to the United States Government only.) 1.
Contents INTRODUCTION 5 Purpose and Scope ........................................................5 Required Reading ...........................................................5 Supported Devices..........................................................6 The SPECTRUM Model ..................................................6 Terminology ....................................................................7 Hub Chassis ................................................................
Contents Contents MIM Performance View.................................................42 Port Performance View .................................................42 CONFIGURATION VIEWS 43 Configuration View ........................................................43 Model Configuration ......................................................44 Device Configuration.....................................................44 Bridge Information.........................................................
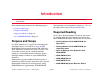
Introduction This section introduces the SPECTRUM Device Management documentation for ethernet hubs manufactured by Cabletron. This introduction contains the following topics: • Purpose and Scope • Required Reading • Supported Devices (Page 6) • The SPECTRUM Model (Page 6) functionality and navigation techniques, refer to the topics listed under Required Reading.
Introduction Supported Devices Supported Devices Table 1: SPECTRUM management module SM-CSI1000 currently lets you model the Cabletron Ethernet Hub family of devices.
Introduction Terminology The device-specific Icon Subviews menu options available from the Device icon are listed below. Modeling results in the creation of Device icons that represent the devices and Application icons that represent their supported applications. Option The Device icons contain double-click zones and provide access to Icon Subviews menus that let you perform device management activities such as those listed in Tasks on Page 9. Figure 1 shows the appearance of the Device icon.
Introduction represent all MIMs that can be installed in a Cabletron hub. Terminology The rest of this document covering the Cabletron Ethernet Hubs management module is organized as follows. Intelligent MIMs • Tasks (Page 9) MIMs that provide network management functions and network media interfacing.
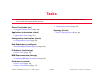
Tasks This section contains an alphabetical list of device management tasks, with each task providing one or more links to views that let you perform the task.
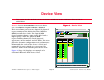
Device View This section describes the Device view and subviews available for models of Cabletron Ethernet Hubs in SPECTRUM. Figure 2: Device View Access: From the Icon Subviews menu for the Device icon, select Device > Logical or Device > Physical. This view allows you to view a logical or physical representation of the Media Interface Modules (MIMs) installed in a hub.
Device View Note: Note: Device View Banner Contact The textual identification and contact information of the person responsible for managing the device. The Hub_CSI_MRXi and Hub_CSI_ MiniM model types do not support the Logical/Physical submenu, and provide access to the Logical Device View through the Device menu item. Manufacturer The manufacturer of the device. Description A textual description of the device.
Device View MMAC Device Panel Device Panel when accessed by selecting the Physical Device View from the Icon Subviews Menu. The MMAC Device Panel appears in the Device View in both the logical and physical MIM representations. The MMAC Device Panel displays the following information about the hub. information presented in the Logical MIM horizontal bar gauges. The Logical MIM bar gauges appear under the name of the module (e.g., IRM2) and under each module port.
Device View Table 2: MMAC Device Panel Table 2: Logical Gauge Menu Options Option Logical Gauge Menu Options Option Definition Definition Frames Indicates frames received or transmitted by the module or port. Align_Errors Indicates misaligned packets detected by the module or port. Bytes Indicates bytes received or transmitted by the module or port. CRC_Errors Indicates packets with bad Cyclical Redundancy Checks (CRCs) received by the module or port.
Device View MMAC Device Statistics Panel Figure 3: MMAC Device Statistics Panel Table 3: Gauge Mode Menu Options Option Percentages Rates Definition Li Fri Jan 31 08:05:19 1996 Displays the selected statistic as a percentage of the total statistics for the module. MMAC Device Statistics 1000 800 Displays the selected statistic as a rate over a given time frame.
Device View Logical MIM Representation Logical MIM Representation Logical Gauges This button allows you to change the statistics represented in the horizontal gauges for the entire MMAC. When you single-click on the Logical Gauges button, a menu appears. The horizontal bar gauge changes color depending on the statistic being represented. The following table provides a list of the menu options and their corresponding gauge color definitions.
Device View Gauge Control Panel Port Performance Indicates the frame rate for the port. You can change this display using the Gauge Control Panel, which is described later in this chapter. When you have accessed the Logical MIM representation through the Physical MIM representation, the Port Performance label displays a gauge. The rates or percentages measured by this gauge depend on the setting of the Logical Gauges and Gauge Mode buttons.
Device View Physical MIM Representation Selected Attribute This area of the Gauge Control Panel allows you to select the statistical attribute displayed on the Logical Interface Icon’s Gauge. The label changes color to reflect the attribute selected. Gauge Mode This area of the Gauge Control Panel allows you to select the mode presented by the Logical Gauge. Possible selections are Totals, Rates, or Percentages.
Device View Physical MIM Representation Figure 4 and Figure 5 are examples of Device Views showing modules in a physical representation.
Device View Port Source Address View Port Source Address View Device Type The SPECTRUM model type name of the hub. The Port Source Address View is available from the IRBM, IRM2, IRM3, and MiniMMAC Device Views. This view allows you to display the Source Address information for the port. To open the Port Source Address View, follow these steps. Slot/Port Number The slot number and the port number in this format: 1.1 (Slot number 1, Port number 1).
Device View IRM2 Hubs Fail (Error) This LED is located on the top of the left-hand LED column. It indicates that a problem has been detected with the SIRM. CLN (Collision Present) This LED is located on the top of the right-hand LED column and is not labelled in SPECTRUM. It indicates that the SIRM is detecting a collision signal from one of the segments connected to the hub. Unlabeled 1 This LED is located below the Fail LED. It indicates that the SIRM is receiving network management packets.
Device View IRM3 Hubs P1 (Port 1 OK) This LED is lit to indicate that the Network Interface Chip associated with the IRM-2’s external repeater port has passed an internal Loop Back Test and is ready for transmission. R1(Receive 1) This LED is located to the left of the P1 LED. It indicates the IRM2 is repeating a data packet received from the segment connected to the IRM2 AUI Port or Fiber Optic Port. LN (Link) This LED is located below the IRM2’s AUI port.
Device View IRBM Hubs PW (Power) This LED is located above the AUI port and to the right of the ON LED. It indicates that the AUI port is receiving power. ON (FO) This LED is located below the AUI port and to the left of the LN LED. It indicates that the fiber optic port is the active repeater port. LNK (Link) This LED is located below the AUI port and to the right of the ON LED. It indicates that a link has been established between the port and the fiber optic device.
Device View MiniMMAC Hubs packets transmitted and packets received for the entire hub as follows. XMT (Transmit) This LED indicates that the hub is transmitting packets to the segment connected to it. POWER This LED indicates that the hub is receiving power. MiniMMAC Hubs LNK (Link) This LED indicates that a link has been established between the module and the 10BASET device at the other end of the twisted pair segment. This LED remains lit as long as the link is maintained.
Device View Changing MIM Representations XMT (Transmit) This LED is located on the back of the MiniMMAC. It indicates that the hub is transmitting packets to the segment connected to it. Changing MIM Representations on a Single Module Using the Menu Bar Changing MIM Representations 1 From the Physical representation of the Device View, move the mouse pointer onto the module. Single-click the left mouse button. 2 Select the Icon Subviews from the View menu. 3 Select the Go Logical menu option.
Device View 1 Changing MIM Representations From the Physical representation of the Device View, move the mouse pointer onto the module. Note: Note: Make sure that the mouse pointer is not on top of, or next to, a gauge or port connector (depending on the initial MIM presentation) otherwise a Port Performance View will open. 2 Double-click the left mouse button. The appearance of the selected module changes. A selected single module appears to extend from the hub chassis.
Device Topology View This section describes the Device Topology view available for models of Cabletron ethernet hubs. Figure 6: Access: From the Icon Subviews menu for the Device icon, select DevTop. The Device Topology view (Figure 6) shows the connections between a modeled device and other network entities. The lower panel of the view uses Interface icons to represent the device’s serial, network, and I/O ports.
Application Views This section describes the main Application view and the associated application-specific subviews available for models of Cabletron ethernet hubs in SPECTRUM. Figure 7: Main Application View Access: From the Icon Subviews menu for the Device icon, select Application.
Application Views Main Application View For more information on this view, refer to the MIBs and the Application View documentation. This button provides access to the SNMP System Group View (Page 29). The Application Views for Cabletron Ethernet hubs are similar. There are only two differences: UDP • The IRBM Hub Application View provides an extra button (the Bridge Databases button), which presents bridging statistics on the IRBM hub.
Application Views HASPART Panel System Up Time The time since the hub network management software was last reinitialized, displayed in the following format: days+hours:minutes:seconds UPS This button, available only in the IRM3 Application View, provides access to the UPS Statistics View (Page 38). System Object Id The Structure of Management Information (SMI) identification of the network management subsystem contained in the hub.
Application Views SNMP ICMP Group View Msgs with no Ports The total number of received UDP datagrams for which there was no application at the destination port. SNMP ICMP Group View Parameter Problems Displays the total number of ICMP parameter problem messages received or transmitted by the hub. This indicates an error in an IP datagram’s header. You can access the SNMP ICMP Group View by clicking on the ICMP button in the Application View.
Application Views SNMP IP Group View This button allows you to access an additional SNMP ICMP Group View which provides the following information. TimeStamp Request or the total number of times the hub transmitted a TimeStamp Reply to a network device from which it received a TimeStamp Request. TimeStamp Replies confirm the network time delay between devices.
Application Views SNMP IP Group View The SNMP IP Group View displays the following information. IP Forwarding Displays whether the hub is operating as a gateway or a host. Default TTL Displays the default Time-To-Live (TTL) value, in seconds, that is found in the IP header of datagrams if a TTL value was not provided by the transport layer protocol. In Packets Displays the total number of datagrams received including those with errors.
Application Views SNMP IP Group View IP Add Table This button allows you to access the IP Address Table. This table provides the hub IP address, interface index, subnet mask and broadcast address. The Print button allows you to print out a copy of the table to a printer or a file. Doubleclicking on a table entry opens the IP Address Table Information View. Table 6 provides the information displayed by the IP Address Table Information View.
Application Views Table 7: SNMP IP Group View IP Route Table Information View Fields Field Definition Destination Addr The destination IP address of this route. An address of 0.0.0.0 is considered a default route. Next Hop Addr The IP address of the next hop on this route. Interface The local interface through which the next hop on this route should be reached. Route Age The number of seconds since this route was last updated or determined to be correct.
Application Views Table 8: SNMP IP Group View Table 8: SNMP IP Group View Information Field Out Packets Out Discards Out No Routes Field Definition Reassembly Fails Displays the total number of IP datagram fragment reassembly failures detected by the IP reassembly algorithm due to time out, errors, etc. Displays the number of transmitted datagrams discarded even though no errors were encountered to prevent their continued processing.
Application Views IRBM MMAC Bridge Database View IRBM MMAC Bridge Database View You can access the IRBM MMAC Bridge Database View by clicking on the Bridge Databases button in the IRBM MMAC Application View. The IRBM MMAC Bridge Database View provides the following information. Dynamic Entries The number of entries that have been accumulated in the acquired database through the bridge’s learning process.
Application Views IRBM MMAC Bridge Database View To add a new source address to the database, type the address into the New Source Address field below the Acquired Database Table. Current Entries The number of entries currently recorded in the bridge’s permanent database. Maximum Entries The maximum number of entries allowed in the permanent database. Select Filtering This button allows you to access an IRBM MMAC Filter Selection View that lets you update filter selections for new source addresses.
Application Views UPS Statistics View Select Filtering This button allows you to access an IRBM MMAC Filter Selection View that lets you update filter selections for new source addresses. Table 10: IRBM MMAC Permanent Database Table Field Definition Entry Type The entry type: Static or Dynamic. Source Address The source address of entries allowed in permanent database. Port1 Out The outbound port for packets entering port 1. Port2 Out The outbound port for packets entering port 2.
Application Views UPS Statistics View Battery Capacity The current battery capacity of the UPS. Values are displayed as a percentage. Additional fields show the Average and the Peak Value of this quantity. UPS Uptime in Hours The amount of time that the UPS connected to the IRM3 has been running since start-up. Battery Volts Out The battery output voltage. Additional fields show the Average and the Peak Value of this quantity. AC Line Volts In The input line voltage.
Application Views UPS Statistics View the network statistics in Logarithmic or Linear format.
Performance Views This section provides brief descriptions of the Performance views available for the Cabletron ethernet hubs in SPECTRUM. Performance views display performance statistics in terms of a set of transmission attributes, e.g., cell rates, frame rates, % error, etc. A typical view is shown in Figure 8. The instantaneous condition of each transmission attribute is recorded in a graph. The statistical information for each attribute is presented in the adjacent table.
Performance Views Device Performance View Device Performance View Port Performance View Access: From the Icon Subviews menu for the Device icon, select Performance. Access: From the Icon Subviews menu for a selected port label in the Device view, select Port Performance. Current and historical frame transmission information is provided via the following attributes. Current and historical packet transmission information is provided via the following attributes.
Configuration Views This section describes the various Configuration views available for models of the Cabletron ethernet hubs in SPECTRUM. Configuration views let you view and modify current settings for the modeled device and its interfaces, ports, and applications. Figure 9: Device Configuration View SpectroGRAPH: 132.127.118.
Configuration Views Model Configuration Model Configuration Polling Status This area of the Configuration view contains the fields described below. This button allows you to disable SpectroSERVER polls of a device by setting Polling Status to False. This button is useful in disabling rollup conditions for minor network events such as workstation power-downs. This button will also set all of the models collected by this hub to false. If set to true, models collected by this hub will be set to true.
Configuration Views Bridge Information PROM Revision The revision number of the hub firmware. Current Date A character representation of the current date. This field does not appear in the MRXI Configuration View. MMAC Type The type of MMAC, for example, 3, 5, or 8-slot MMAC (e.g., MMAC3, MMAC5, MMAC8). You supply the MMAC type when you create the icon. The default is MMAC8. This button is not available in the MRXI or the MiniMMAC Configuration Views.
Configuration Views Configuration View Buttons Find Source Address Redundancy This button allows you to access the hub’s Source Address View, which is described later in this chapter. This button is not available in the IRM or the MRXI Configuration Views. This button allows you to access the MMAC Redundancy View, which is described later in this chapter. This button is not available in the IRBM or the IRM Configuration Views.
Configuration Views Source Address View Source Address View Table 11: You can access the Source Address View by clicking on the Find Source Address button in the Configuration View. This view gives you the ability to trace a MAC address to the board and port where the address is detected, and provides the following information. This view is not available for IRM or the MRXI hubs.
Configuration Views Control View Device Name An ASCII name of the device that this agent manages. This field does not appear in the IRM Control View. This button causes the device and all devices connected to it to send Link-up traps. This button is not available in the IRM, IRM3, or MRXI Control Views. Network Address The network IP address (e.g., 132.127.118.24). This field does not appear in the IRM Control View.
Configuration Views Configure Alarms View Traffic Threshold The threshold value within the alarm timebase which, once that number of packets is exceeded, generates a traffic alarm. Factory Defaults This button allows you to reset the device’s settings to their factory defaults. This button is only available in the IRM2 and IRM3 Control Views. (Does not affect IP address) Collision Alarms Configure Alarms View You can access this view by clicking on the Config Alarms button in the Configuration View.
Configuration Views Configure Alarms View Broadcast Alarms Sound Audible Alarm This button allows you to Enable or Disable detection of Broadcast Alarms. This button is available only in the IRM2 and IRM3 Configure Alarms Views. This button permits a management station to turn off a sounding alarm. Attempting to change this button to the ON position may result in a write failure error. You must have a community name with Read/Write permission to update this feature.
Configuration Views Table 12: Error Redundancy View Error Source Table Fields Definition Align Measures the number of misaligned frames detected by the hub. Runts Measures the number of runt frames detected by the hub. Giants Measures the number of packets longer than 1,518 bytes detected by the hub. CRC Measures the number of packets with bad Cyclic Redundancy Checks (CRCs) detected. OOW Measures the number of Out-Of-Window (OOW) collisions detected by the hub.
Configuration Views Redundancy View Test Redundant Circuits Table 13: MMAC Redundancy Information View Fields This button allows you to test the redundant circuit. Field Test Time of Day The time of day at which the redundant circuits should be tested. This field is not available in the MRXI Redundancy View. Circuit Name The name of the indicated circuit. Retry Count The number of unanswered polls allowed for the indicated circuit before the current connection is declared bad.
Configuration Views Table 13: Redundancy View MiniMMAC opens the Address Display View. The Address Display View has two fields: Polled Address, which is the MAC address, and Instance, which is the board number and port number associated with the address. For example, 1.1 is board 1, port 1. The IRM3 has no Address Display View. MMAC Redundancy Information View Fields Field Definition Circuit Enable Enables or disables the indicated circuit.
Configuration Views Redundancy View The IRM2, MRXI, and MiniMMAC Address Delete Views allow you to double-click on the Polled Addresses in the Redundancy Table to access an Address Display View. The Address Display View has two fields: Polled Address, Address which is the MAC address, and Instance, Instance which is the board number and port number associated with the address. For example, 1.1 is board 1, port 1. the IRM3, the MRXI, and the MiniMMAC hubs.
Configuration Views Redundancy View Firmware Start Address The jump address of the firmware in RAM as established by the boot process. Table 16: DownLoad Software View Field Definitions Field Model Name DownLoad Software This button allows you to access the DownLoad Software View. This view allows you to upgrade the hub’s firmware from a TFTP Boot Server. Table 16 describes the fields provided by this view. SPECTRUM Enterprise Manager Definition The user-defined or default name of the hub model.
Configuration Views Redundancy View Table 16: DownLoad Software View Field Definitions Field Table 16: Definition Force On Boot When set to Server, the boot software will attempt to boot from the TFTP boot server. If no boot is found and flash memory is valid, the device will boot from the flash memory regardless of the setting for this variable. When set to Flash_Memory, the device will boot from flash memory.
Configuration Views Redundancy View Community and Trap Table You can access the Community and Trap Table by clicking the Community Table in the Configuration View. The Sort buttons allow you to alter the display format of the table. The Find button allows you to search the name column to locate a specific community name. Clicking on a column heading allows you to access the Sort and Find Buttons. The Update button allows you to update the contents of the table.
Configuration Views Table 17: Bridge Configuration View Community Table Detail View Field Definitions Field Definition Model Name The user-defined or default name of the hub model. Community String The current community name. Access The user access permissions for the community name. Possible values are: none, readonly, readwrite, and superuser. Trap Host The IP address of the host to which traps will be sent. Traps Toggles trap generation. Possible values are: enabled or disabled.
Configuration Views Configuration View Buttons Device Configuration Bridge/Root Information This section of the Bridge Configuration View contains the fields described below. This button allows you to access the Bridge/Root Information View. Table 18 provides the information contained in the view. Bridge Name The user-defined name of the bridge. The default is ETHERNET BRIDGE. Table 18: Bridge Type The type of bridge (e.g., NB25E, IRBM, or NB20E).
Configuration Views Additional Bridge Information Configuration View Buttons Table 19: This button allows you to access the Additional Bridge Information View. Table 19 provides the information contained in the view. Additional Bridge Information View Fields Field Definition Model Name The user-defined name or default name of the model. Bridge Priority The part of the bridge address that contains the identifier used in the spanning tree for priority comparisons.
Configuration Views Configuration View Buttons Table 20: Setup Information View Fields Bridge Setup Information Field This button allows you to access the Setup Information View. Table 20 provides the information contained in the view. Table 20: Bridge ID The unique identifier of the bridge. The first two bytes of the identifier are the bridge priority and the last six bytes are the Ethernet address. Switch Settings The current switch settings read from the bridge hardware.
Configuration Views Configuration View Buttons Topology Information Fwd Dly & Hello Information This button allows you to access the Topology Information View. Table 21 provides the information contained in the view. Table 21: This button allows you to access the Forward Delay & Hello Information View. Table 22 (Page 63) provides the information contained in the view. Topology Information View Table Fields Field Definition Model Name The user-defined or default name of the model.
Configuration Views Table 22: Hub Redundancy Management Forward Delay & Hello Information View Fields Field Definition Model Name The user-defined or default name of the model. Forward Delay Parm The value of the forward delay parameters when the bridge is the root or attempting to become root. A time of 4 to 30 seconds is allowed. Forward Delay This button allows you to access the IRBM Bridge Control View. Table 23 provides the information contained in the view.
Configuration Views Hub Redundancy Management • MRXI Although circuit connections typically occur between devices in the same room, the circuit connections can also occur over longer distances between floors or buildings (with the proper FDDI cables and associated modules). Refer to Figure 10 (Page 65) for an illustration of a typical redundant cable circuit connection between two redundant hub devices.
Configuration Views Setting Redundant Circuits Figure 10: Redundantly Connected Hub Device Primary Hub Device 5 MT8 S 1 5 IRB MT8 S S 1 BM M ON ST RC DN CR PO 4 2 4 2 ON RH NK DN CR PO C O N R L R L R L R L 6 3 6 3 8 4 8 4 C O A NS LK F TH O RH ETH- Backup Inactive Circuit Primary Active Circuit 5 MT8 S 1 5 IRB MT8 S S 1 BM M ON ST RC DN CR PO 4 2 4 2 ON RH NK DN CR PO C O N R L R L R L The following example illustrates redundancy between hubs.
Configuration Views Setting Redundant Circuits be used with MRXI and MiniMMAC hubs as primary devices. The secondary device can be any hub device with redundancy capability (e.g., MRXI, MiniMMAC, IRM2, IRM3). This procedure may also be used to configure multiple secondary hub devices. SPECTRUM Enterprise Manager Page 66 Note: Note: These instructions assume that you have a primary MMAC hub module port physically attached to a secondary MMAC hub module port.
Configuration Views Setting Redundant Circuits To set redundant circuits for the devices modeled in SPECTRUM, follow these steps: 1 Click on the icon to select it. 2 If contact has been established and the icon is green, bring up the Configuration View. 3 From the Configuration View menu, click on the Redundancy button. In the Redundancy View window, click on Redundancy Table.
Configuration Views Setting Redundant Circuits redundancy setup information is present and correct. 13 Click on the Circuit Enable field and choose Enable. Enable This enables the circuit that was created on the primary hub device. Choose Save All Changes from the File menu. 14 Now physically connect the secondary circuit between the two hub devices. To test the redundancy, disconnect the primary circuit and make sure the backup circuit becomes active.
Diagnostic View This section provides a brief overview of the Diagnostic view. • Buttons allow you to access increasingly detailed views of network information, to select a graphical representation for the error attributes, and to bring up the Events and Alarms Log Views. Access: From the Icon Subviews menu for the Device icon, select Diagnostic. Note: Note: There is no Diagnostic View for the IRBM, IRM2, IRM3, or MiniMMAC hub.
Diagnostic View MRXI Hubs Total The total number of collisions counted since the device was powered on. Alarms This button allows you to access the IRM MMAC Alarms View. The Alarms View displays a list of current network alarms. For information on how to use the Alarms View, refer to Enterprise Alarm Manager. Last Poll The number of collisions counted since the last poll. Total Collisions This button displays a graph showing SIRM MMAC Hub Collisions.
Diagnostic View MRXI Hubs Last Poll (Transmit Collisions) The number of transmit collisions detected by the MRXI Hub since SPECTRUM last polled the device. Last Poll (Receive Collisions) The number of receive collisions detected by the MRXI Hub since SPECTRUM last polled the device. graph shows the time in seconds broken into five minute intervals. The right axis shows the rate of collisions that occurred in the last polling interval.
Diagnostic View MRXI Hubs Events This button allows you to access the Event Log containing a list of network events specific to the hub. You can scroll through the Event Log using the menu or the scroll bars. Alarms This button displays the MRXI MMAC Alarms View. The Alarms View displays a list of current network alarms. For information on how to use the Alarms View, refer to the SPECTRUM Operator’s Reference.
Index A Access 57, 58 Permissions 57, 58 Additional Bridge Information Button 60 View 60 Additional Configuration 46 Address Delete View 53 Button 53 Display View 54 Alarms Button 70, 72 View 72 Alignment 51 Applications 27 Apply Button 17 Audible Alarm 50 AUI 45, 64 BrdgFiber_Off 45 BridgeFiber_Rptr 45 Off Fiber_Brdg 45 Fiber_Rptr 45 Rptr Fiber_Brdg 45 Fiber_Off 45 B Bd/Port Combination 52 Board Number 47 Port Instance 53, 67 Bridge ID 61 Information Button 59 View 59 Priority 60 Restart 63 Settings 63 S
Index Index Device Counters 48 Discover 48 Name 57 Redundancy 48 DevTop Views 26 Documentation 5 DownLoad Software Button 55 Software View 55 Source Address Button 46 Flash Download 46 Force On Boot 56 Forward Delay 63 Hello Information View 62 Parm 63 Fwd Dly & Hello Information Button 62 E G Enable 68 Error Source Table 50 Event Button 70, 71 Log 70, 72 Events 72 Giants 51 F Factory Defaults 49 FDDI 64 Fiber Optic 64 Ports 45 Find Board/Port Button 47 I Icons Device 7 Instance 54 IP Addr 57 Addre
Index Address Add 52 Field 67 Delete 53 Management Tasks 9 MMAC Redundancy Information View 52 Table 52 View 46 Type 45 MMAC3 45 MMAC5 45 MMAC8 45 Model Information 69 Name 47, 55, 58, 59, 60, 61, 62, 63 Type Names 6 Types of 6 MRXI Hub Receive Collisions 71 Transmit Collisions 71 N Name 57 Network Address 47, 55 Alarms 70, 72 Index Events 70, 72 Network I/O ports 26 No Resource 51 None 58 Number of Addresses 52 Restarts 61 Primary 64 Circuit 65 Pathway 64 Port 64 Protocol Max Age 60 R O OOW 51 Operat
Index Circuit View Button 54 Restart Device 48 Restricted Rights Notice 2 Retry Count 52, 67 Root Brdg Max Age 59 Bridge ID 59 Cost 59 Information Button 59 View 59 Port 59 Runts 51 S Secondary Circuit 65 Secondary Circuit 64 Serial ports 26 Setup Information View 61 SIRM MMAC Hub Collisions 70 Sound Audible Alarm 50 Source Addr Lock 48 Traps 48 Index Address 47, 48 Table 48 Button 46 Src Addr Age Time 48 STA Protocol 61 Statistics Routing Frame Transmission 42 Superuser 58 Switch Settings 61 T Test Re