
Installation Guide


Questions? (888) 788-2254
www.CaliBrands.com
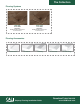
Odyssey Flooring Installation Guide
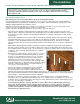
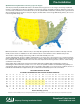
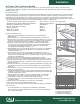
Optimum Flooring Moisture Content (%) by U.S. Region
This map is provided by the NWFA and relates to all hardwood flooring species. For each region, the average equilibrium
moisture content (EMC) for hardwood is identified for both January and July. The EMC is the MC (%) that the floor will reach
once it has fully acclimated to its environment. This is also the optimum MC for installation, and will provide a general idea of
what acclimation measures to take. In each pair of figures, the first number is the average EMC during January; the second
is the average EMC during July.
Note: Actual moisture content conditions in any location may differ significantly from these numbers. This map cannot be
reliably used as a basis for installation. The most reliable moisture-content numbers can be obtained at the job site.
Take moisture content readings of the flooring, subfloor and relative humidity to be sure.
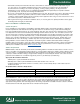
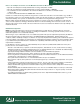
To better understand the specific acclimation requirements for your home, refer to the chart below for correlations between
relative humidity (RH), temperature, and flooring moisture content (%). Referencing the weather conditions in your area, find
the combination of temperature and RH on the chart. This value represents the flooring moisture content to achieve during
acclimation for best results.
Values within chart’s shaded area represent environments with relative humidity (RH) and temperature capable of
maintaining the delivered moisture content of 6% to 10%. These are optimum conditions for maximum flooring stability. For
environments outside of this range, allow more time for acclimation. Depending on your local in-home conditions, the use of
humidification/dehumidification equipment may be recommended to maintain proper in-home environment.
MOISTURE CONTENT OF WOOD
AT VARIOUS TEMPERATURES AND RELATIVE HUMIDITY READINGS
30 1.4 2.6 3.7 4.6 5.5 6.3 7.1 7.9 8.7 9.5 10.4 11.3 12.4 13.5 14.9 16.5 18.5 21.0 24.3 26.0
40 1.4 2.6 3.7 4.6 5.5 6.3 7.1 7.9 8.7 9.5 10.4 11.3 12.4 13.5 14.9 16.5 18.5 21.0 24.3 26.0
50 1.4 2.6 3.7 4.6 5.5 6.3 7.1 7.9 8.7 9.5 10.4 11.3 12.4 13.5 14.9 16.5 18.5 21.0 24.3 26.0
60 1.3 2.5 3.6 4.6 5.4 6.2 7.0 7.8 8.6 9.4 10.2 11.1 12.1 13.3 14.6 16.2 18.2 20.7 24.1 26.8
70 1.3 2.5 3.5 4.5 5.4 6.2 6.0 7.7 8.5 9.2 10.1 11.0 12.0 13.1 14.4 16.0 17.9 20.5 23.9 26.6
80 1.3 2.4 3.5 4.4 5.3 6.1 6.8 7.6 8.3 9.1 9.9 10.8 11.7 12.0 14.2 15.7 17.7 20.2 23.6 26.3
90 1.2 2.3 3.4 4.3 5.1 5.9 6.7 7.4 8.1 8.9 9.7 10.5 11.5 12.6 13.9 15.4 17.3 19.8 23.3 26.0
100 1.2 2.3 3.3 4.2 5.0 5.8 6.5 7.2 7.9 8.7 9.5 10.3 11.2 12.3 13.6 15.1 17.0 19.5 22.9 25.6
5 10 15 20 25 30 35 40 45 50 55 60 65 70 75 80 85 90 95 98
Relative Humidity (percent)
Chart taken from Wood Handbook: Wood as an Engineering Material (Agriculture Handbook, 72). Forest Products Laboratory, U.S. Department of Agriculture
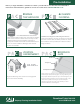
Pre-Installation