INSTRUCTION MANUAL AP200 CO2/H2O Atmospheric Profile System Revision: 4/14 C o p y r i g h t © 2 0 1 2 - 2 0 1 4 C a m p b e l l S c i e n t i f i c , I n c .
Limited Warranty “Products manufactured by CSI are warranted by CSI to be free from defects in materials and workmanship under normal use and service for twelve months from the date of shipment unless otherwise specified in the corresponding product manual. (Product manuals are available for review online at www.campbellsci.com.) Products not manufactured by CSI, but that are resold by CSI, are warranted only to the limits extended by the original manufacturer.
Assistance Products may not be returned without prior authorization. The following contact information is for US and international customers residing in countries served by Campbell Scientific, Inc. directly. Affiliate companies handle repairs for customers within their territories. Please visit www.campbellsci.com to determine which Campbell Scientific company serves your country. To obtain a Returned Materials Authorization (RMA), contact CAMPBELL SCIENTIFIC, INC., phone (435) 227-9000.
Precautions DANGER — MANY HAZARDS ARE ASSOCIATED WITH INSTALLING, USING, MAINTAINING, AND WORKING ON OR AROUND TRIPODS, TOWERS, AND ANY ATTACHMENTS TO TRIPODS AND TOWERS SUCH AS SENSORS, CROSSARMS, ENCLOSURES, ANTENNAS, ETC. FAILURE TO PROPERLY AND COMPLETELY ASSEMBLE, INSTALL, OPERATE, USE, AND MAINTAIN TRIPODS, TOWERS, AND ATTACHMENTS, AND FAILURE TO HEED WARNINGS, INCREASES THE RISK OF DEATH, ACCIDENT, SERIOUS INJURY, PROPERTY DAMAGE, AND PRODUCT FAILURE.
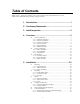
Table of Contents PDF viewers: These page numbers refer to the printed version of this document. Use the PDF reader bookmarks tab for links to specific sections. 1. Introduction ................................................................. 1 2. Cautionary Statements ............................................... 1 3. Initial Inspection ......................................................... 2 4. Overview ...................................................................... 2 4.
Table of Contents 5.6.3 On-site System Checks............................................................... 39 6. Infrared Gas Analyzer (IRGA) Zero and Span .........40 6.1 6.2 Automatic Zero and Span .................................................................. 40 Manual Zero and Span....................................................................... 41 6.2.1 Check Zero and CO2 Span.......................................................... 41 6.2.2 Do CO2 and H2O Zero .........................
Table of Contents J. AP200 Pump Replacement...................................... J-1 J.1 J.2 J.3 Introduction ....................................................................................... J-1 Removal ............................................................................................ J-1 Installation ......................................................................................... J-4 4-1. 4-2. 4-3. 4-4. 4-5. Interior of AP200 system enclosure .................................
Table of Contents 5-14. Tabs for opening intake assembly ..................................................... 30 5-15. Wiring of heater cable on AP200 intake assembly ............................ 30 5-16. Three intake assemblies with heater cables daisy chained to the AP200 system enclosure ................................................................ 31 5-17. Proper wiring of power cable onto DIN bus of AP200 system enclosure .............................................................................
Table of Contents H-4. H-5. Dimensions and Part Numbers for Swagelok® Plugs ...................... H-4 Dimensions and Part Numbers for Swagelok® Caps .......................
Table of Contents vi
AP200 CO2/H2O Atmospheric Profile System 1. Introduction The AP200 CO2/H2O Atmospheric Profile System (AP200) measures atmospheric carbon dioxide and water vapor at up to eight positions. Intake assemblies are normally spaced along the height of a tower to enable measurement of a vertical profile. The AP200 is commonly used in conjunction with an eddy-covariance system to measure the storage term to give a more complete measurement of the surface exchange.
AP200 CO2/H2O Atmospheric Profile System o o 3. Careful design of the power source for the AP200 should be undertaken to ensure uninterrupted power. If needed, contact a Campbell Scientific applications engineer for assistance. Retain all spare caps and plugs as these are required when shipping or storing the AP200 system. Initial Inspection Upon receipt of the AP200, inspect the packaging and contents for damage. File damage claims with the shipping company. Model numbers are found on each product.
AP200 CO2/H2O Atmospheric Profile System FIGURE 4-1. Interior of AP200 system enclosure The AP200 intake assembly (pn 27693) includes an orifice to set the flow rate, a filter that removes particulates, and a rain diverter to admit a sample of ambient air without allowing precipitation to enter. The rain diverter is heated to prevent condensation. The intake assembly includes a mixing volume to dampen fluctuations in ambient concentrations of CO2 and H2O. The closed intake assembly is shown in FIGURE 4-2.
AP200 CO2/H2O Atmospheric Profile System NOTE Intake assemblies shipped prior to August 2013 had the rain diverter located at the end of the assembly rather than below, as shown in FIGURE 4-3. This assembly also uses a different filter, which is shown in FIGURE 4-13, and available for replacement as pn 27809. Rain Diverter FIGURE 4-3. Side view of earlier generation AP200 intake assembly 4.1.
AP200 CO2/H2O Atmospheric Profile System To store data on a CompactFlash® (CF) memory card, the AP200 requires either an NL115 or a CFM100 (FIGURE 4-5) both available from Campbell Scientific. Either storage module will provide data storage. The NL115 has the added capabilities provided by an Ethernet interface. FIGURE 4-5.
AP200 CO2/H2O Atmospheric Profile System FIGURE 4-7. AP200 keyboard display mounted in system enclosure NOTE This user interface is also available using a hand-held, detachable keyboard display, the CR1000KD, as described in Section 4.1.4, Other Accessories. The CR1000KD may be preferred when multiple AP200s are to be maintained. The factory-mounted keyboard display is permanently attached, so it cannot be forgotten or misplaced.
AP200 CO2/H2O Atmospheric Profile System tubing has an aluminum core to minimize diffusion through the tubing wall and a UV-resistant, black, high-density polyethylene jacket. Maximum tubing length available is a 500-ft roll. Intake Heater Cabling: The intake assemblies have a small heater in the rain diverter to prevent condensation. For normal applications, bulk cable is cut to length and installed on site to provide power to the intake assemblies.
AP200 CO2/H2O Atmospheric Profile System than their commercial counterparts. Campbell Scientific recommends the use of industrial-grade cards, such as the CFMC2G (FIGURE 4-6) available from Campbell Scientific. For more details about this card, see Application Note 3SM-F, CF Card Information, available from www.campbellsci.com. USB Memory Card Reader/Writer: The 17752 USB memory card reader/writer, shown in FIGURE 4-9, is a single-slot, high-speed reader/writer that allows a computer to read a memory card.
AP200 CO2/H2O Atmospheric Profile System 4.1.4 Other Accessories Portable Keyboard: The CR1000KD, shown in FIGURE 4-11, is a portable keyboard and display screen for the CR1000 datalogger. The CR1000KD can check the datalogger's status, display or plot sensor readings and stored values, and allows the user to enter numeric data.
AP200 CO2/H2O Atmospheric Profile System CR1000 in the AP200. The apps support field maintenance tasks such as viewing and collecting data, setting the clock, and downloading programs. 4.1.6 Replacement Parts Syringe Filter: Intake assemblies shipped after August 2013 use a syringe filter with Luer lock connections. The filter is an in-line 2.5-cm (1.0-in) diameter, PTFE membrane filter (FIGURE 4-12) of 3-micron pore size.
AP200 CO2/H2O Atmospheric Profile System Humidity Indicator Card: The replacement humidity indicator (FIGURE 4-15) card is pn 28878. FIGURE 4-15. Humidity indicator card Diaphragm Pump: The pump module for the AP200 includes a small doublehead diaphragm pump with a brushless DC motor. The pump includes a speedcontrol input and a tachometer to measure actual pumping speed. It is mounted in an insulated, temperature-controlled box inside the AP200 system enclosure.
AP200 CO2/H2O Atmospheric Profile System valves, adjusts pumping speed to control system pressure, and controls the temperatures of the pump and valve manifold. FIGURE 4-17 is a plumbing diagram showing the various parts of the AP200 system connected. Details for each part of the system are given in this section. FIGURE 4-17.
AP200 CO2/H2O Atmospheric Profile System 4.2.1 Intake Assemblies The AP200 intake assembly (pn 27693) includes a heated rain diverter, an inline filter, an orifice, and a mixing volume on a common mounting bracket with rain cover, shown opened in FIGURE 4-18. The inline filter element, pn 29998, is a 2.5-cm (1.0-in) diameter, PTFE membrane with a 3-micron pore size. It removes particulates from the air sample that could clog the orifice or valve. FIGURE 4-18.
AP200 CO2/H2O Atmospheric Profile System 105 Ambient Pressure (kPa) 100 95 90 85 80 75 70 65 0 500 1000 1500 2000 2500 3000 Elevation (m) FIGURE 4-19. Nominal ambient pressure as related to increasing elevation FIGURE 4-20 shows the nominal sample flow as a function of ambient pressure, assuming a 35-kPa pressure drop across the orifice. 250 Sample Flow (ml/min) 240 230 220 210 200 190 180 70 75 80 85 90 95 100 Ambient Pressure (kPa) FIGURE 4-20.
AP200 CO2/H2O Atmospheric Profile System The flow will also vary with ambient temperature due to the corresponding change in air density. Higher-temperature air has lower density, which will have lower flow (approximately 2% lower flow for a 10°C temperature change). The sample flow will decrease over time as particulates clog the filters. Eventually, the flow will be reduced to the extent that it will degrade the equilibration time after an intake is selected.
AP200 CO2/H2O Atmospheric Profile System The valve manifold has eleven inlets (eight for air samples and three for zero/span) and two outlets (sample and bypass). Each air sample inlet has a three-way solenoid valve that connects it to one of the two outlets. This valve connects its corresponding inlet to the bypass outlet when it is off and to the sample outlet when it is energized. The sample outlet connects to the IRGA and the bypass outlet connects directly to the pump.
AP200 CO2/H2O Atmospheric Profile System FIGURE 4-22. Pump module of AP200 system The AP200 pump module pulls air through the system and exhausts it through the Exhaust fitting on the bottom of the system enclosure. It uses a small double-head diaphragm pump with a brushless DC motor. This pump includes a speed control input and a tachometer to measure the actual pumping speed. It is mounted in an insulated, temperature-controlled box inside the AP200 system enclosure.
AP200 CO2/H2O Atmospheric Profile System Pump Temperature: The temperature of the pump module is reported in public variable pump_tmpr. The operating range of the pump is 0°C to 55°C. If the pump temperature is outside this range, the AP200 will disable the pump. The pump module has a heater (8 W) that turns on if the pump temperature falls below 2°C. If the AP200 is started at cold temperature, it may take up to 50 minutes to warm the pump module (from –30°C to 0°C).
AP200 CO2/H2O Atmospheric Profile System Average power varies from 14 W above 30°C to 24 W at –30°C as shown in FIGURE 4-23. This includes 2.0 W for the intake heaters (8 intake assemblies at 0.25 W each). FIGURE 4-23.
AP200 CO2/H2O Atmospheric Profile System 4.3.3 Intake Assembly Dimensions: Weight: Filter: Orifice: Heater: Mixing volume: Sample connection: Heater cable entry seals Number of connections: Cable diameter: Heater cable screw terminals Wire diameter: Wire stripping length: Screw tightening torque: 5. 27.9 cm x 12.5 cm x 19.0 cm (11.0 in x 5.0 in x 7.5 in) 1.4 kg (3.1 lb) 1.0 in diameter, inline PTFE membrane filter, 3 micron pore size, CSI pn 29998 0.007-in inside diameter 560 ohms (0.
AP200 CO2/H2O Atmospheric Profile System • • Large pole (4.0-in to 10.0-in diameter) No mounting bracket Consult the ENC10/12, ENC12/14, ENC14/16, ENC16/18 Instruction Manual, available at www.campbellsci.com, for details on mounting bracket options. 5.1.2 AP200 Enclosure Mount the AP200 system enclosure where it can be accessed easily to retrieve data from the CF cards on the datalogger. The AP200 system enclosure is similar to the ENC16/18 enclosure, and it has the same mounting options available.
AP200 CO2/H2O Atmospheric Profile System assembly on smaller pipes, orient the mounting clips with their notches toward the pipe, as shown it FIGURE 5-2. For larger pipes, orient the mounting clips with their notches away from the pipe, as shown in FIGURE 5-3. NOTE Orienting the mounting clip with its notch against the mounting pipe will help to prevent rotation of the intake assembly, which can happen for small-diameter pipes. For larger pipe diameters, greater than approximately 3.9 cm (1.
AP200 CO2/H2O Atmospheric Profile System FIGURE 5-3. Mounting clip orientation for pipe diameters between 3.9 and 5.1 cm FIGURE 5-4. Installation of AP200 assembly on a small-diameter pipe (left) and large-diameter pipe (right) 5.2 Plumbing 5.2.1 Profile Sample Tubes A sample tube must be used to bring the air sample from each intake assembly to the AP200 system enclosure. Campbell Scientific pn 15702 or equivalent is recommended.
AP200 CO2/H2O Atmospheric Profile System FIGURE 5-5. Tubing connections on bottom of AP200 enclosure NOTE If the AP200 system enclosure is mounted low to the ground, it may be difficult to read the label on the bottom of the enclosure. For convenience, the inlet connections are also labeled on the inside of the enclosure as shown in FIGURE 5-6. FIGURE 5-6.
AP200 CO2/H2O Atmospheric Profile System FIGURE 5-7 shows the tubing connections from the intake assemblies to the system enclosure. FIGURE 5-7. Tubing connections from four intake assemblies connected to inlets 1 – 4 5.2.2 Zero and CO2 Span The AP200 can perform automated zero (CO2 and H2O) and CO2 span of the IRGA. This requires the user to supply cylinders of zero air and CO2 span gas, with appropriate regulators. NOTE Use high-quality gases for the zero and CO2 span.
AP200 CO2/H2O Atmospheric Profile System FIGURE 5-8. AP200 system enclosure configured with cylinders of zero air and CO2 NOTE Flow meters and needle valves are not needed because the AP200 zero and span inlets have flow restriction inside the system enclosure to set the flow rate. Make sure there are no leaks in the regulators or the connections to the valve module. For automatic operation, the tank shutoff valves are left continuously open.
AP200 CO2/H2O Atmospheric Profile System FIGURE 5-9. H2O span inlet configured for a dewpoint generator 5.3 Wiring 5.3.1 Ground Connection The AP200 must be earth grounded. Refer to section 7.1, ESD Protection in the CR1000 Measurement and Control System Operator’s Manual, for information on earth grounding and lightning protection. All component grounds of the AP200 profile system are pre-wired at the factory to a common ground lug located at the bottom of the enclosure.
AP200 CO2/H2O Atmospheric Profile System 5.3.2 Intake Heater Cables The AP200 intake assemblies have a small heater in the rain diverter to prevent condensation. Power for these heaters is available in the AP200 system enclosure. Campbell Scientific pn 9922 cable or equivalent is recommended for connecting the intake assemblies to the system enclosure. The system is designed to daisy-chain the heater cables from one intake assembly to the next as described below and shown in FIGURE 5-16.
AP200 CO2/H2O Atmospheric Profile System FIGURE 5-12. Proper wiring of heater cable onto DIN bus of AP200 system enclosure NOTE To connect a wire to the DIN rail terminal blocks of the AP200 enclosure, insert a small screwdriver into the square hole to open the spring-loaded contacts as shown in FIGURE 5-13. Insert the wire into the corresponding round hole and remove the screwdriver. Gently tug the wire to confirm it is secure. FIGURE 5-13.
AP200 CO2/H2O Atmospheric Profile System Route the heater cable to the first intake assembly and cut it to the needed length. Open the intake assembly cover by gently spreading the tabs on the lower-front corner and tilting it back. See FIGURE 5-14. Push at tabs to open FIGURE 5-14. Tabs for opening intake assembly Loosen the nut on one of the three cable glands (to avoid the risk of dropping the nut, do not remove it completely). Insert the cable and tighten the nut.
AP200 CO2/H2O Atmospheric Profile System Insert and connect a second length of heater cable for the next intake assembly. Continue this “daisy chain” from one intake assembly to the next until all of the intake assemblies are connected as shown in FIGURE 5-16. Intake assemblies will accommodate a third heater power cable that may be used to branch off to another intake assembly. This may be useful if the intake assemblies are mounted on two or more towers. FIGURE 5-16.
AP200 CO2/H2O Atmospheric Profile System TABLE 5-1. Equivalent Resistance for Intake Heaters Connected in Parallel 4 5 6 7 8 Number Of Heaters Nominal Resistance (ohms) 140 112 93 80 70 Acceptable Range (ohms) 133 to 147 106 to 118 88 to 98 76 to 84 66 to 74 5.3.3 Power The AP200 requires a 10 Vdc to 16 Vdc power source. The average power consumption varies with ambient temperature, mostly due to the heater in the IRGA that maintains its sample cell at 50°C.
AP200 CO2/H2O Atmospheric Profile System FIGURE 5-17. Proper wiring of power cable onto DIN bus of AP200 system enclosure To relieve strain on the AP200 cables, use a cable tie to secure the cables to the cable-tie loop on the pump module as shown in FIGURE 5-18. FIGURE 5-18. Power cables secured to cable tie loop on pump module of AP200 enclosure Replace the cap on the AP200 enclosure feedthrough.
AP200 CO2/H2O Atmospheric Profile System This will relieve further strain on the cable and also minimize air infiltration to extend the life of the enclosure desiccant packs. FIGURE 5-19. Cut-away view showing proper replacement of feedthrough cap NOTE In very humid conditions, it may be helpful to seal the cable feedthrough with plumber’s putty. The AP200 stores energy in a capacitor to provide backup power in the event power is interrupted.
AP200 CO2/H2O Atmospheric Profile System PC200W, which may be downloaded from www.campbellsci.com. The AP200 uses some constants as “compile switches” to define the state of the system during compilation. Variables may be edited while the program is running using either a keyboard display or a PC connected through PC200W, PC400, or LoggerNet. Variables that define the operational configuration of the system are defined as system configuration variables.
AP200 CO2/H2O Atmospheric Profile System LEVELS_USED: This is the number of profile levels (air sample intakes) to be sampled. It must be an integer from four to eight. If fewer than eight inlets are used, they should be connected to the lowest-number inlets (starting with one). The default is eight. The next five variables configure the automatic calibration (zero/span) sequence. See Section 6, Infrared Gas Analyzer (IRGA) Zero and Span, for details.
AP200 CO2/H2O Atmospheric Profile System BATT_LOWLIMIT as appropriate to protect his battery. If AC main power and an AC/DC adapter are used, the limit may be left at 9.7 V. BATT_DEADBAND: This variable, along with BATT_LOWLIMIT, determine when the AP200 will restart after an automatic power shutdown. The AP200 will not restart until the supply voltage batt_volt reaches at least BATT_LOWLIMIT + BATT_DEADBAND.
AP200 CO2/H2O Atmospheric Profile System Sequence Timing, for timing details). When the sequence is restarted, the AP200 will set seq_ACTIVE = True and STARTsequence = False. STOPsequence: Allows the user to stop the sequence. Set this variable to True to stop the automatic valve switching sequence. The AP200 will immediately set seq_ACTIVE = False and leave the valve_number in its current state. valve_number: Controls which valve is selected.
AP200 CO2/H2O Atmospheric Profile System valve_number: this is normally an integer from 1 to 8, indicating which profile level is being sampled. If the sequence is active, this number should increment approximately every 15 s (see Appendix F, Valve Sequence Timing, for details). It may be 9 (Zero) or 10 (CO2 Span) if the zero/span sequence is running. The corresponding LED on the valve module should be ON.
AP200 CO2/H2O Atmospheric Profile System 6. Infrared Gas Analyzer (IRGA) Zero and Span The IRGA should be zeroed and spanned periodically to maintain its accuracy. There are three ways to accomplish this: 1. 2. 3. The IRGA can be removed from the AP200 system and zeroed and spanned per the manufacturer’s recommendation. See Section 7.4.
AP200 CO2/H2O Atmospheric Profile System After these variables are set, the valve sequence must be restarted to make the changes effective. See Section 5.5, Starting and Stopping the Sequence, for detail on starting and stopping the sequence. The program will then set its timing variables as appropriate for the options selected (see Appendix F, Valve Sequence Timing, for details). 6.2 Manual Zero and Span This section describes how to perform a manual zero and span of the IRGA.
AP200 CO2/H2O Atmospheric Profile System If seq_ACTIVE is True, then set STOPsequence = True to stop the sequence and then verify that seq_ACTIVE changes to False. Set valve_number to Zero (9). Look at the LEDs on the valve module to confirm the selected valve is now active. The CO2_SPAN_PPM variable displays the concentration in the CO2 span tank. Check the value of diag_AP200. If it is not zero, a problem in the AP200 system should be resolved before continuing (see Appendix B, AP200 Diagnostics).
AP200 CO2/H2O Atmospheric Profile System Wait for the value of CO2 and H2O to stabilize. This normally takes one to two minutes. Set DO_zero to True. The AP200 will send the commands to the IRGA to do a CO2 zero and then an H2O zero. While the IRGA is setting to zero, the values for CO2 and H2O will not be available and NAN (not a number) will be displayed. This will take approximately 20 s. When the process is complete, CO2 and H2O will again be displayed.
AP200 CO2/H2O Atmospheric Profile System 6.2.4 Do H2O Span At the Manual Zero/Span menu, select Do H2O Span. This menu guides the user through the steps to flow the H2O span gas and to send the command to the IRGA to set its H2O span. H2O is more difficult to span than CO2 due to the difficulty of providing a source of air with known humidity. Therefore, a dewpoint generator, such as the LI-610 (LI-COR®, Inc., Lincoln, NE), is used for many applications.
AP200 CO2/H2O Atmospheric Profile System If seq_ACTIVE is True, then set STOPsequence = True to stop the sequence, and then verify seq_ACTIVE changes to False. Variable cell_press is the pressure in the IRGA sample cell. Set pump_ON = False to turn the pump off and it should be possible to hear the pump stop. Wait for the value of cell_press to rise and stabilize to ambient pressure. This may take several minutes as the intake tubes and mixing volumes fill with air.
AP200 CO2/H2O Atmospheric Profile System NOTE To avoid pulling unfiltered air into the AP200, do not shut down or disconnect the dewpoint generator until the valve sequence has been restarted as described in Section 6.2.5, Restart the Sequence. Press to return to the Manual Zero/Span menu. 6.2.5 Restart the Sequence At the conclusion of the manual zero/span process, restart the automatic valve sequence. Go to the last line of the Manual Zero/Span menu and set STARTsequence = True.
AP200 CO2/H2O Atmospheric Profile System Some common causes of leaks include: • • • 7.2 Forgetting to tighten a fitting during the installation. It is good practice to check all of the tube connections before turning the system on. If a fitting can be loosened with fingers, it is not properly tightened. Dirt or debris in the tube fitting. Use care when connecting or disconnecting tubes, and install caps and plugs on tubes and fittings when they are not in use. Excessive bending.
AP200 CO2/H2O Atmospheric Profile System FIGURE 7-1. Releasing rain diverter from intake assembly Slide the foam insulation down the tube to expose the filter. Unthread the rain diverter from the filter. Place the rain diverter loosely in its mounting hole to keep it from falling. Unthread the filter from the orifice. NOTE To avoid the risk of dropping the orifice, keep the orifice attached to the tube. The orifice usually does not need to be replaced as a result of normal usage.
AP200 CO2/H2O Atmospheric Profile System FIGURE 7-2. Order of replacement for orifice, filter, and rain diverter Thread the rain diverter onto the filter and slide the insulation back down the tube to the filter. Press the rain diverter back through its opening in the intake assembly. See FIGURE 7-3. NOTE Take care not to loosen the connections between the rain diverter, filter, orifice, and tube when snapping the rain diverter back into its mounting hole. Restart the pump and check the sample flow.
AP200 CO2/H2O Atmospheric Profile System 7.4 LI-840A (IRGA) Consult the LI-COR® LI-840A manual (at www.licor.com) for details on maintaining the IRGA. The following section gives details on installation/removal and configuration of the IRGA as it relates to its installation in the AP200. 7.4.1 Installing and Removing the IRGA The IRGA is easily installed or removed from the AP200 system. The installed IRGA is shown in FIGURE 7-4. To install the IRGA in the AP200: 1. 2. 3. 4. 5.
AP200 CO2/H2O Atmospheric Profile System To remove the IRGA from the AP200: 1. 2. 3. 4. 5. 6. Disconnect power from the AP200. Disconnect the power connector from the IRGA. Leave the wires connected to the terminal block and pull the terminal block out of the IRGA. If the IRGA is to be powered outside the AP200, use the spare terminal block supplied with the IRGA. Disconnect the serial cable from the IRGA. Disconnect the inlet and outlet tubes from the IRGA.
AP200 CO2/H2O Atmospheric Profile System message_log output table when the configuration command is sent and when the settings are acknowledged. The IRGA settings are given in TABLE 7-1. TABLE 7-1. IRGA Settings Setting Value Notes OUTRATE 0.5 Output data every 0.5 s HEATER TRUE Turn heater on PCOMP TRUE Pressure compensation on FILTER 0 No filter The outputs from the IRGA are shown in TABLE 7-2 and include: TABLE 7-2. IRGA Outputs 7.
AP200 CO2/H2O Atmospheric Profile System Assume there are eight profile levels and that the AP200 is configured to set the zero and span every four hours. From Appendix F, Valve Sequence Timing, the zero/span sequence will select the CO2 span cylinder for 40 s, the zero cylinder for 100 s, and then the CO2 span cylinder again for 70 s. The total sequence time for the CO2 span cylinder will be 110 s (as, 40 s + 70 s = 110 s) and 100 s for the zero cylinder.
AP200 CO2/H2O Atmospheric Profile System 54
Appendix A. Keyboard Display Menu The AP200 CRBasic program includes a custom menu for the keyboard display. This menu provides a user-friendly interface for some of the more common functions which are shown below. The custom menu can be bypassed such that the user can interact directly with the datalogger through the datalogger’s default menus. To bypass the custom menus, select .
Appendix A.
Appendix A.
Appendix A.
Appendix B. AP200 Diagnostics The public variable diag_AP200 indicates conditions outside the normal operating range for the AP200. Any value other than zero indicates a problem. Diag_AP200 contains several error flags encoded as binary bits. To diagnose a problem, first decode the value according to TABLE B-1 and then see the corresponding section in this appendix. TABLE B-1.
Appendix B. AP200 Diagnostics Second, because it is an average over time, it is impossible to tell which bits are set. For example, an average of 4.0 could mean that bit 3 (numeric value = 4) is set all the time or it could mean that bit 4 (numeric value = 8) is set half the time, etc. For this reason, diag_AP200_Avg can indicate only whether or not there was a problem (nonzero value) or not. If diag_AP200_Avg is nonzero, use the time series of diag_AP200 in the RawData table to diagnose the problem.
Appendix B. AP200 Diagnostics Bit 2: Valve temperature is outside its operating range Bit 2 of diag_AP200 indicates the valve temperature is outside its operating range. This triggers the AP200 to shut down the valves and pump to protect the valves from possible damage. To confirm the problem, verify that public variable valve_tmpr_OK = False. This variable is set to True if the valve temperature is within its operating range and is set to False if it is outside this range.
Appendix B. AP200 Diagnostics Also check the measured pump temperature, pump_tmpr and compare it to the operating range (0°C to 55°C). The pump module has a heater that turns on if pump_tmpr falls below 2°C. If the pump temperature is too low, check the operation of the heater which is controlled by public variable pump_heat_ON. This variable is saved in RawData only if saving all diagnostics. Its corresponding variable pump_heat_Avg is saved in the averaged output tables (IntAvg, CalAvg, and SiteAvg).
Appendix B. AP200 Diagnostics If the pump pressure is too low, check pump_control and pump_speed. When the pressure falls below the setpoint, the AP200 will respond by reducing pump_control. This should reduce pump_speed and allow pump_press to rise to the setpoint. If pump_control = 0 but the pump is still running, contact Campbell Scientific. If the pump speed is oscillating, check the value of BuffDepth. This variable is found in the Status table (see the CR1000 User Manual at www.campbellsci.
Appendix B. AP200 Diagnostics Zero/Span Inlets The sample flow for zero/span inlets is set by restriction in the small, stainless steel tubes that connect the bulkhead fittings to the valve manifold. See Section 4.2.2, Valve Manifold, for details. If the flow goes too high at a valve switch, but comes into the normal range in a few seconds, this is normal. It is caused by the pressure regulator on the cylinder. See notes on pressure regulators in Section 7.5, Zero/Span Flow.
Appendix C. Public Variables Some of the variables in the AP200’s CRBasic program are included in the Public table. These public variables may be displayed or edited with a keyboard display or PC. Other program variables are hidden from the user to reduce clutter in the Public table. Many of these public variables are saved in the output tables. Some of the public variables allow the user to set the operation of the system or to give diagnostic information.
Appendix C. Public Variables TABLE C-1.
Appendix C. Public Variables TABLE C-1.
Appendix C.
Appendix D. Output Tables The AP200 program stores data in several output tables. Details are given for each table. IntAvg The primary output table is IntAvg (Interval Average). A record is written to this table at the end of every output interval (30 min). Space is allocated on the memory card for 4,800 records (100 days at one record per 30 min). The CPU has storage allocated for 480 records (10 days).
Appendix D. Output Tables TABLE D-1.
Appendix D. Output Tables TABLE D-1.
Appendix D. Output Tables TABLE D-1. Variables of the IntAvg Table Units Statistic When Used in Calculation When Included in Table T_air_Avg(3) °C Avg all N_AirTemps > 2 T_air_Avg(4) °C Avg all N_AirTemps > 3 T_air_Avg(5) °C Avg all N_AirTemps > 4 T_air_Avg(6) °C Avg all N_AirTemps > 5 T_air_Avg(7) °C Avg all N_AirTemps > 6 T_air_Avg(8) °C Avg all N_AirTemps > 7 Name CalAvg The CalAvg table contains data from the automated zero/span sequences.
Appendix D. Output Tables TABLE D-2.
Appendix D. Output Tables TABLE D-2.
Appendix D. Output Tables TABLE D-3.
Appendix D. Output Tables RawData The RawData table stores each sample of the AP200 data (two records per second). This table is normally used only for troubleshooting. The files on the card and in the CPU are allocated to use remaining available space. The number of days for which space is available on the card will depend on the options chosen. The first set of values is always stored in RawData. The air temperature profile data are stored as determined by constant N_AirTemps.
Appendix D. Output Tables TABLE D-4.
Appendix D. Output Tables AUTO_ZEROSPAN, CAL_INTERVAL, and CAL_TIMEOFFSET. The next value, sync_interval, is calculated by the program. It is the duration of the valve sequence in seconds. This value is used by the program to synchronize the valve sequence to the real-time clock. For example, if sync_interval is 90 s, the sequence will start at the top of the hour, or 1:30 later, or 3:00 later, etc. The rest of the TimeInfo contains the arrays of timing parameters.
Appendix D. Output Tables TABLE D-5.
Appendix D. Output Tables TABLE D-5. Variables of the TimeInfo Table Name Units CalOmitCounts(3) CalOmitCounts(4) CalOmitCounts(5) CalOmitCounts(6) CalOmitCounts(7) CalOmitCounts(8) Message_log The message_log table contains a history of events, and is intended as a troubleshooting tool.
Appendix E. Temperature Profile The AP200 system can measure a temperature profile at up to eight levels, with 107-L temperature probes. These temperature probes are not part of the AP200 system – they must be ordered separately. See the Model 107 Temperature Probe Instruction Manual, available from Campbell Scientific, www.campbellscientific.com, for details. The following section gives brief instructions for using these temperature probes with the AP200 system.
Appendix E.
Appendix F. Valve Sequence Timing The AP200 has two valve sequences: the profile sequence and the calibration (zero/span) sequence. The AP200 will run the majority of the time in the profile sequence, cycling through the profile inlets in order from one to the number of levels selected (4 to 8). If configured for automatic zero/span, then the AP200 will periodically run the calibration sequence before returning to the profile sequence.
Appendix F. Valve Sequence Timing The profile sequence timing parameters are implemented in the AP200 CRBasic program as a set of three arrays. These arrays have eight locations to accommodate up to eight levels. These arrays are not accessible in the Public table, but they are output to the TimeInfo table as a record of the system configuration. See Appendix D, Output Tables, for details on this table.
Appendix F. Valve Sequence Timing Example 2: LEVELS_USED = 5, STARTsequence set to True at 9:00:20. As shown in TABLE F-1, the cycle time for 5 levels is 90 s. To synchronize with the real-time clock, the sequence must start at multiples of 90 s, (for example, 9:00:00, 9:01:30, 9:03:00, etc.) Valve 1 will be selected as soon as STARTsequence is set = True (9:00:20), but the sequence will not actually start until 9:01:30.
Appendix F. Valve Sequence Timing time). For example, if there are eight levels used, the profile cycle time is 120 s. This means 40 s must be added to the zero/span sequence. This has been allocated as 10 s extra (each) for the span and zero, and 20 s extra for equilibration on level 1 at the end of the sequence. The zero/span sequence takes the place of one profile cycle for five, six, seven, or eight levels. However, if there are four levels used, the profile cycle time is only 60 s.
Appendix F. Valve Sequence Timing • Select inlet 1 to allow at least 10 s extra equilibration time. This allows the humidity in the tubing and IRGA to equilibrate before restarting the profile sequence. As shown in TABLE F-4, this minimum timing adds up to 170 s for the zero/span sequence. The timing parameters are adjusted as needed to equal a multiple of the profile sequence cycle time. For example, if there are 8 levels used, the profile cycle time is 120 s.
Appendix F.
Appendix G. AC/DC Adapter Kit The 28549 AC/DC Power Adapter Kit allows an AP200 CO2/H2O Atmospheric Profile System to be powered from AC mains power. To install the 28549 in an AP200 system enclosure, untie the power adapter output cable and feed it under the tubes below the AP200 pump module. Position the power adapter on the rubberized tab and secure it with the Velcro strap as shown in FIGURE G-1. FIGURE G-1.
Appendix G. AC/DC Adapter Kit NOTE The wire with the white stripe goes to the positive input terminal. FIGURE G-3. Cable extension connected to AP200 power input terminal If the power adapter kit was ordered with a detachable power cord, remove the AP200 enclosure feedthrough cap, insert the end of the power cord, and plug it into the power adapter.
Appendix G. AC/DC Adapter Kit FIGURE G-4. AC power cord secured within AP200 system enclosure Plug the AC power cord into AC mains power, 100 Vac to 240 Vac, 47 Hz to 63 Hz. Plug the power adapter output cable into the cable extension as shown in FIGURE G-5. FIGURE G-5.
Appendix G.
Appendix H. Using Swagelok® Fittings This appendix gives a few tips on using Swagelok® tube fittings. For more information, consult a local Swagelok® dealer or visit their website at www.swagelok.com. General Notes: • • • • • • • Do not use fitting components from other manufacturers. They are not interchangeable with Swagelok® fittings. Do not attempt to use metric fittings—6.0 mm is very close to 0.25 in, but they are not interchangeable.
Appendix H. Using Swagelok® Fittings 1. 2. 3. Do not remove the nuts and ferrules from the fitting. Simply insert the tube into the assembled fitting until it bottoms out. Rotate the nut until it is finger tight. While holding the fitting body steady, tighten the nut until it feels tight. Normally, this will be less than one full turn. Tightening a full one and one-quarter turns will damage the threads on the fitting and nut.
Appendix H. Using Swagelok® Fittings FIGURE H-1. Swagelok® insert TABLE H-2. Dimensions and Part Numbers for Swagelok® Inserts Tubing OD (in) Tubing ID (in) Swagelok® pn CSI pn 1/4 1/8 B-405-2 15834 1/4 0.17 B-405-170 15830 1/4 3/16 B-405-3 15713 3/8 1/4 B-605-4 9845 1/2 3/8 B-815-6 17380 5/8 1/2 B-1015-8 19495 Ferrules Each Swagelok® fitting comes assembled with the front and back ferrules included.
Appendix H. Using Swagelok® Fittings Plugs Swagelok® plugs are used to plug a fitting when its tube is disconnected. It is strongly recommended to plug all fittings to keep them clean. Spare plugs may be needed if they become lost or damaged. FIGURE H-3. Swagelok® plug TABLE H-4.
Appendix H. Using Swagelok® Fittings TABLE H-5.
Appendix H.
Appendix I. Useful Equations Dewpoint Temperature Calculations The IRGA reports the dewpoint temperature (public variable Td_cell), but this represents the conditions in the sample cell. The AP200 converts this to dewpoint temperature in the ambient air, Td_ambient.
Appendix I. Useful Equations Calculate the ambient dewpoint temperature: 240.97 z 17.502 − z Buck, eq. 7a 10eamb z = ln 6.1121 f 3 Buck, eq.
Appendix J. AP200 Pump Replacement J.1 Introduction A properly maintained AP200 system will exceed the lifetime of the system’s pump. This section provides step-by-step instructions for the user to replace the system pump (pn 26402), rather than needing to return the pump enclosure to Campbell for replacement. J.2 Removal The AP200 pump module is mounted to the left side of the AP200 system enclosure as shown in FIGURE J-1. Pump enclosure FIGURE J-1.
Appendix J. AP200 Pump Replacement 2. Remove the six screws that hold the cover on the AP200 pump module enclosure (see FIGURE J-2). If the screws become lost or damaged, they can be replaced with pn488. FIGURE J-2. Location of six screws of pump enclosure cover 3. Remove the cover to expose the pump (FIGURE J-3). FIGURE J-3. AP200 pump 4. J-2 Remove pump connector from the pump electronics (FIGURE J-4).
Appendix J. AP200 Pump Replacement FIGURE J-4. Location of pump connector in AP200 pump electronics 5. Gently lift the pump assembly from foam, leaving the tubing attached. 6. Turn assembly over and remove the two self-tapping #6 screws that attach the pump to the metal box, as shown in FIGURE J-5. If these screws become lost or damaged, replace them with pn 13535. FIGURE J-5. Self-tapping screws attaching pump to metal box 7.
Appendix J. AP200 Pump Replacement FIGURE J-6. Location of cuts to remove pump assembly from tubing 8. Remove the pump from the assembly. J.3 Installation To reinstall the AP200 pump, carry out the following steps: 1. Position the pump with the label up and connect the coiled tubing on both sides of the pump (see FIGURE J-7). Blue tubing connects the inlets and red connects the outlets as directional arrows show on the side of the pump (FIGURE J-8). FIGURE J-7.
Appendix J. AP200 Pump Replacement FIGURE J-8. Pump side with inlet and outlet tubing connected 2. NOTE NOTE Reattach the pump to metal box with two self-tapping screws on the back of the pump module electronics plate (FIGURE J-5). Be careful to not pinch the fan wires under the pump and do not overtighten the screws. 3. Reattach the pump connector to the pump electronics (FIGURE J-4). 4. Place the pump assembly back into the foam of the pump enclosure (FIGURE J-3). 5.
Appendix J.
Campbell Scientific Companies Campbell Scientific, Inc. (CSI) 815 West 1800 North Logan, Utah 84321 UNITED STATES www.campbellsci.com • info@campbellsci.com Campbell Scientific Centro Caribe S.A. (CSCC) 300 N Cementerio, Edificio Breller Santo Domingo, Heredia 40305 COSTA RICA www.campbellsci.cc • info@campbellsci.cc Campbell Scientific Africa Pty. Ltd. (CSAf) PO Box 2450 Somerset West 7129 SOUTH AFRICA www.csafrica.co.za • cleroux@csafrica.co.za Campbell Scientific Ltd.