CR5000 Measurement and Control System Revision: 11/06 C o p y r i g h t © 2 0 0 0 - 2 0 0 6 C a m p b e l l S c i e n t i f i c , I n c .
Warranty and Assistance The CR5000 MEASUREMENT AND CONTROL SYSTEM is warranted by CAMPBELL SCIENTIFIC, INC. to be free from defects in materials and workmanship under normal use and service for thirty-six (36) months from date of shipment unless specified otherwise. Batteries have no warranty. CAMPBELL SCIENTIFIC, INC.'s obligation under this warranty is limited to repairing or replacing (at CAMPBELL SCIENTIFIC, INC.'s option) defective products.
CR5000 MEASUREMENT AND CONTROL SYSTEM TABLE OF CONTENTS PDF viewers note: These page numbers refer to the printed version of this document. Use the Adobe Acrobat® bookmarks tab for links to specific sections. PAGE OV1. PHYSICAL DESCRIPTION OV1.1 OV1.2 OV1.3 Measurement Inputs ........................................................................................................... OV-1 Communication and Data Storage......................................................................................
CR5000 TABLE OF CONTENTS 3. 3.1 3.2 3.3 3.4 3.5 3.6 3.7 3.8 4. 4.1 4.2 4.3 4.4 4.5 4.6 4.7 4.8 CR5000 MEASUREMENT DETAILS Analog Voltage Measurement Sequence .............................................................................. 3-1 Single Ended and Differential Voltage Measurements .......................................................... 3-4 Signal Settling Time ...............................................................................................................
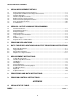
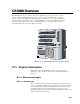
CR5000 Overview The CR5000 provides precision measurement capabilities in a rugged, battery-operated package. The system makes measurements at a rate of up to 5,000 samples/second with 16-bit resolution. The CR5000 includes CPU, keyboard display, power supply, and analog and digital inputs and outputs. The on-board, BASIC-like programming language includes data processing and analysis routines. PC9000 Software provides program generation and editing, data retrieval, and realtime monitoring.
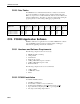
CR5000 Overview 1 H SE 21 DIFF H 1 11 2 3 L H 22 23 L H 2 12 SWITCHED CURRENT EXCITATION (IX) ExciteI Resistance 4 5 L H 3 24 25 L H 13 6 7 L H 26 27 L H 4 14 8 9 L H 28 29 L H 5 15 10 11 L H 30 31 L H 6 16 12 13 L H 32 33 L H 7 17 14 15 L H 34 35 L H 8 18 CONTROL I/O PortGet PortSet ReadIO TimerIO WriteIO 16 17 L H 36 37 L H 9 19 18 19 L H 38 39 L H 10 20 20 L 40 L COMPUTER RS-232 (OPTICALLY ISOLATED) SE
CR5000 Overview OV1.1.2 Signal Grounds ( ) The Signal Grounds ( ) should be used as the reference for Single-ended Analog inputs, Excitation returns, and sensor shield wires. Signal returns from the CAO and Pulse channels should use the terminals located on the CAO and Pulse terminal strip to minimize current flow through grounds on the analog terminal strips. the OV1.1.3 Power Grounds (G) The Power Grounds (G) should be used as the returns for the 5V, SW12, 12V, and C1-C8 outputs.
CR5000 Overview OV1.1.10 Control I/O There are 8 digital Input/Output channels (0 V low, 5 V high) for frequency measurement, digital control, and triggering. OV1.1.11 Pulse Inputs Two Pulse input channels can count pulses from high-level (5 V square wave), switch closure, or low-level A/C signals. OV1.1.12 Power Up The CR5000 allows shutting off power under program control. The Power Up inputs allow an external signal to awaken the CR5000 from a powered down state (PowerOff, Section 9).
CR5000 Overview OV1.3 Power Supply and AC Adapter The CR5000 has two base options the low profile without any power supply and the lead acid battery power supply base. The low profile base requires an external DC power source connected to the Power In terminal on the panel. The battery base has a 7 amp hour battery with built in charging regulator and includes an AC adapter for use where 120 VAC is available (18 VAC RMS output). Charging power can also come from a 17-28 VDC input such as a solar panel.
CR5000 Overview OV2.3 Data Tables The CR5000 can store individual measurements or it may use its extensive processing capabilities to calculate averages, maxima, minima, histogams, FFTs, etc., on periodic or conditional intervals. Data are stored in tables such as listed in Table OV2-1. The values to output are selected when running the program generator or when writing a datalogger program directly. Table OV2-1. Typical Data Table TOA4 TIMESTAMP TS 1995-02-16 15:15:04.61 1995-02-16 15:15:04.
CR5000 Overview You may use the default directory of PC9000 or install the software in a different directory. The directory will be created for you. To abort the installation, type Ctrl-C or Break at any time. OV3.3 PC9000 Software Overview This overview points out the main PC9000 functions and where to find them. PC9000 has extensive on-line help to guide the user in its operation, run PC9000 to get the details.
CR5000 Overview File Edit Realtime Analysis Tools Collect Display Data Retrieval . . . Scheduled Data Retrieval . . . CommLink Select Series Linked Station . . . Select Parallel Linked Station . . . Logger Clock . . . Logger Status . . . Download . . . Save and Download Logger Files . . . Diagnostics Display Data Graph 1 . . . Display Data Graph 2 . . . ID2000 . . . Ctrl + I Alarms List . . . Field Monitor . . . Virtual Meter . . . Virtual O'Scope . . . X-Y Plotter . . . Histogram . . .
CR5000 Overview File Edit Realtime Analysis Undo Date & Time Select All Strip Remarks and Spaces Cut Copy Paste Delete Delete Line Ctrl + Y Wrap Text Go To Line . . . Find Replace Tools Collect Colors . . . Fonts . . . Defaults . . . Ctrl + Z Ctrl + S Ctrl + X Ctrl + C Ctrl + V Editing Options for Active Windows Ctrl + W Display Windows Help Change fonts and/or Colors for Active Windows. Tile Horizontal . . . Tile Vertical . . . Cascade . . . Arrange Icons . . . Work Area Setup . . .
CR5000 Overview Virtual Oscilloscope Displays up to six channels. Time base variable from milliseconds to hours. X-Y Plotter Allows comparison of any two measurements in real time. OV3.3.3 Analysis Data Graphing Displays up to 16 fields simultaneously as strip charts or two multi-charts with up to 8 traces each. Includes 2D/3D bars, line, log/linear, area, and scatter. Line statistics available for max/min, best fit, mean, and standard deviation. Handles files of unlimited size.
CR5000 Overview OV4. Keyboard Display Power Up Screen CAMPBELL SCIENTIFIC CR5000 Datalogger 06/18/2000, 18:24:35 CPU: TRIG.CR5 Running.
CR5000 Overview OV4.1 Data Display Data Run/Stop Program File Status Configure, Settings Cursor to Data and Press Enter Real Time Tables Real Time Custom Final Storage Data Reset Data Table Graph Setup List of Data Tables created by active program List of Data Tables created by active program List of Data Tables created by active program All Tables List of Data Tables created by active program Graph Type: Scope Scaler: Manual Upper: 0.000000 Lower: 0.
CR5000 Overview OV4.1.1 Real Time Tables List of Data Tables created by active program. For Example, Table1 Temps Public Cursor to desired Table and press Enter Tref TCTemp(1) TCTemp(2) TCTemp(3) Flag(1) Flag(2) Flag(3) Flag(4) : 23.0234 : 19.6243 : 19.3429 : 21.2003 : -1.0000 : 0.00000 : 0.00000 : 0.00000 Public Table values can be changed. Cursor to value and press Enter to edit value. Press Graph/ Char for Graph of selected field 30.0 22.35 Press Ins for Graph Setup _____ ___ ____ __ 20.
CR5000 Overview OV4.1.2 Setting up Real Time Custom Display List of Data Tables created by active program. For Example, Table1 Temps Public Cursor to desired Table and Press Enter Cursor to position for next value and Press Enter Tref TCTemp(1) TCTemp(2) TCTemp(3) Flag(1) Flag(2) Flag(3) Flag(4) Cursor to desired Field and Press Enter TCTemp(3) : 24.9496 : : : : : : : New values are displayed as they are stored.
CR5000 Overview OV4.1.3 Final Storage Tables List of Data Tables created by active program.
CR5000 Overview OV4.2 Run/Stop Program PCCard Display Data Run/Stop Program File Status Configure, Settings CPU: List of Programs No Program CRD: List of Programs You may now remove the Card. CR5000 closes tables first.
CR5000 Overview OV4.3 File Display Data Run/Stop Program File Status Configure, Settings New File Name: CPU: .CR5 CRD: .CR5 Cursor to File and Press Enter New Edit Copy Delete Run Options Directory Format CPU: CRD: Copy From To Execute List of files on CPU or Card.
CR5000 Overview OV4.3.1 File: Edit The Program Editor in PC9000 is recommended for writing and editing datalogger programs. Changes in the field can be made with the keyboard display. List of Program files on CPU: or CRD: For Example: CPU: TCTEMP.CR5 RACE.CR5 0 0 Save Changes? Yes No ESC Cursor to desired Program and Press Enter INSERT Instruction Function Blank Line Block Insert Off CR5000 ' TCTemp.
CR5000 Overview OV4.
CR5000 Overview OV5. Specifications Electrical specifications are valid over a -25° to +50°C range unless otherwise specified; testing over -40° to +85°C available as an option, excludes batteries. Non-condensing environment required. Yearly calibrations are recommended to maintain electrical specifications.
Section 1. Installation and Maintenance 1.1 Protection from the Environment The normal environmental variables of concern are temperature and moisture. The standard CR5000 is designed to operate reliably from -25 to +50°C (-40°C to +85°C, optional) in noncondensing humidity. When humidity tolerances are exceeded, damage to IC chips, microprocessor failure, and/or measurement inaccuracies due to condensation on the various PC board runners may result.
Section 1. Installation and Maintenance 1.3 CR5000 Power Supplies The CR5000 may be purchased with either a rechargeable lead acid battery or with a low profile case without a battery. While the CR5000 has a wide operating temperature range (-40 to +85°C optional), the lead acid battery base is limited to -40 to +60°C. Exceeding this range will degrade battery capacity and lifetime and could also cause permanent damage. 1.3.
Section 1. Installation and Maintenance LEAD ACID BATTERY REPLACEMENT 6V 7AH LEAD ACID BATTERY + + 6V 7AH LEAD ACID BATTERY RED WHITE BLACK - - FIGURE 1.3-1. Lead Acid Battery Wiring Monitor the power supply using datalogger Instruction “ Battery” . Incorporate this instruction into data acquisition programs to keep track of the state of the power supply. If the system voltage level consistently decreases through time, some element(s) of the charging system has failed.
Section 1. Installation and Maintenance 1.3.2 Low Profile CR5000 The low profile CR5000 option is not supplied with a battery base. See Section 1.5 and 1.6 for external power connection considerations. 1.4 Solar Panels Auxiliary photovoltaic power sources may be used to maintain charge on lead acid batteries.
Section 1. Installation and Maintenance 1 H 1 2 3 L H 2 4 5 L H 3 6 7 L H 8 4 L H 9 10 5 L 11 12 6 H L 13 14 7 H L 15 16 8 H L 17 18 9 H L 19 20 10 H L 29 30 15 H L 31 32 16 H L 33 34 17 H L 35 36 18 H L 37 38 19 H L 39 40 20 H L DCDC1R BOOST REG ULATOR G C3 C2 C1 C4 SW-12 SW-12 G 12V G P1 IXR P1 SDM-C3 SDM-C2 SDM-C1 IX4 SDI-12 12V G IX1 IX2 CAO2 CAO1 IX3 G 5V 5V G >2.0V CONTROL I/O <0.
Section 1. Installation and Maintenance 1.6.2 CR5000 with Low Profile Base (No Battery) If a CR5000 without batteries is to be powered from the 12 Volts of a motor vehicle, a second 12 V supply is required. When the starting motor of a vehicle with a 12 V electrical system is engaged, the voltage drops considerably below 11 V, which would cause the CR5000 to stop measurement every time the vehicle is started. The second 12 V supply prevents this malfunction. Figure 1.
Section 1. Installation and Maintenance Tie analog signal shields and returns to grounds ( ) located in analog input terminal strips. Tie CAO and pulse-counter returns into grounds ( ) in CAO and pulse-counter terminal strip. Large excitation return currents may also be tied into this ground in order to minimize induced single-ended offset voltages in half bridge measurements. Tie 5 V, SW-12, 12 V and C1-C8 returns into power grounds (G).
Section 1. Installation and Maintenance A good earth (chassis) ground will minimize damage to the datalogger and sensors by providing a low resistance path around the system to a point of low potential. Campbell Scientific recommends that all dataloggers be earth (chassis) grounded. All components of the system (dataloggers, sensors, external power supplies, mounts, housings, etc.) should be referenced to one common earth (chassis) ground.
Section 1. Installation and Maintenance 1.7.3 Effect of Grounding on Single-Ended Measurements Low-level single-ended voltage measurements can be problematic because of ground potential fluctuations. The grounding scheme in the CR5000 has been designed to eliminate ground potential fluctuations due to changing return currents from 12 V, SW-12, 5 V, and the control ports. This is accomplished by utilizing separate signal grounds ( ) and power grounds (G).
Section 1. Installation and Maintenance Table 1.8-1 Current Sourcing Limits Terminals Current Source Limit SW12 < 900 mA @ 20°C < 729 mA @ 40°C < 630 mA @ 50°C < 567 mA @ 60°C < 400 mA @ 80°C 12V + SW12 < 1.85 A @ 20°C < 1.50 A @ 40°C < 1.30 A @ 50°C < 1.17 A @ 60°C < 0.85 A @ 80°C 5V + CSI/O < 200 mA Make certain that the primary source of power for the CR5000 can sustain the current drain for the period of time required.
Section 1. Installation and Maintenance 1.9.1 Use of Digital I/O Ports for Switching Relays Each of the eight digital I/O ports can be configured as an output port and set low or high (0 V low, 5 V high) using the PortSet or WriteIO instructions. A digital output port is normally used to operate an external relay driver circuit because the port itself has a limited drive capability (2.0 mA minimum at 3.5 V). Figure 1.
Section 1. Installation and Maintenance FIGURE 1.9-2. Power Switching without Relay 1.10 Maintenance The CR5000 power supplies require a minimum of routine maintenance. When not in use, the rechargeable supply should be stored in a cool, dry environment with the AC charger active. 1.10.1 Desiccant The CR5000 is shipped with desiccant to reduce humidity. Desiccant should be changed periodically.
Section 1. Installation and Maintenance While powered from an external source, the CR5000 measures the voltage of the lithium battery daily. This voltage is displayed in the status table (Section 1.6) A new battery will have approximately 3.6 volts. The CR5000 Status Table has a “ Lithium Battery” field. This field is either “ True” (battery is good) or “ False” (replace battery).
Section 1. Installation and Maintenance O Y N A S The new cell is placed into the battery holder, observing the polarity markings on the holder. Replace the band clamp, ensuring that both ends snap securely into the battery holder. 2 Y R E T A B (datalogger/cr5 000) FIGURE 1.10-5. Loosening of band clamp.
O Y N A S Section 1. Installation and Maintenance FIGURE 1.11-6. Removal of band clamp and battery.
Section 1. Installation and Maintenance This is a blank page.
Section 2. Data Storage and Retrieval The CR5000 can store individual measurements or it may use its extensive processing capabilities to calculate averages, maxima, minima, histograms, FFTs, etc., on periodic or conditional intervals. Data are stored in tables. For simplicity, the PC9000 program generator allows a maximum of three data tables (in the native language up to 30 data tables can be created).
Section 2. Data Storage and Retrieval When a new program is compiled that sends data to the PC card, the CR5000 checks if a card is present and if the card has adequate space for the data tables. If the card has adequate space, the tables will be allocated and the CR5000 will start storing data to them. If there is no card or if there is not enough space, the CR5000 will warn that the card is not being used and will run the program, storing the data in SRAM only.
Section 2. Data Storage and Retrieval TABLE 2.2-3 FP2 Decimal Location Absolute Value 0 7.999 8 79.99 80 - 799.9 800 - 7999. Decimal Location X.XXX XX.XX XXX.X XXXX. 2.3 Data Collection Data can be transferred into a computer using PC9000 via a communications link or by transferring a PC card from the PC9000 to the computer. There are three ways to collect data via a link to the CR5000 using the PC9000 software.
Section 2. Data Storage and Retrieval FIGURE 2.3.1. Collect Data Dialog Box 2.3.1.1 File Type ASCII With Time – Click here to store the data as an ASCII (TOA5, Section 2.4) file. Each record will be date and time stamped. Binary With Time – Click here to store the data as a binary file (TOB1, Section 2.4). Each record will be date and time stamped. ASCII Without Time – Click here to store the data as an ASCII file (TOA5, Section 2.4). There will be no date and time stamps.
Section 2. Data Storage and Retrieval Since Last, Create New File – Click here to save new data in a new file. PC9000 searches for the last file with the Root name, gets the last record number from that file, then the current record from the table in the CR5000, and requests all records in between those numbers from the CR5000. The number in the file name is incremented to create the file name in which the data are stored.
Section 2. Data Storage and Retrieval When the file collection options that create a new file are used, each time a table is collected, the 2 digit number is incremented (e.g., EVENTS00.DAT, EVENTS01.DAT, EVENTS03.DAT ...). PC9000 searches the selected directory and adds 1 to the number of the highest numbered file of the matching name to create the new name.
Section 2. Data Storage and Retrieval 2.3.3 Logger Files Retrieve Logger Files under the PC9000 tools menu allows the user to check the programs stored in CPU Flash memory and the files stored on the PCMCIA cards. Any of the files shown in logger files can be copied to the computer by highlighting the file and pressing the retrieve button. Data files in the CR5000 CPU and Flash memory are not shown. The retrieved data file is stored on the computer in the same form that it was stored on the PC card (TOB2).
Section 2. Data Storage and Retrieval from the CR5000. When a new program is compiled that sends data to the PC card, the CR5000 checks if a card is present and if the card has adequate space for the data tables. If the card has adequate space, the tables will be allocated and the CR5000 will start storing data to them. When the running program sends data to the card, and a card is inserted, the CR5000 will detect the card and display a message.
Section 2. Data Storage and Retrieval When the PC card is inserted in a computer, the data files can be copied to another drive or used directly from the PC card just as one would from any other disk. In most cases, however, it will be necessary to convert the file format before using the data. 2.3.4.3 Converting File Format The CR5000 stores data on the PC card in TOB2 Format. TOB2 is a binary format that incorporates features to improve reliability of the PC Cards.
Section 2. Data Storage and Retrieval "File Format","Station","Logger","Serial No.","OS Ver","DLD File","DLD Sig","Table Name" "TIMESTAMP","RECORD","Field Name","Field Name","Field Name" "TS","RN","Field Units","Field Units","Field Units" "","","Processing","Processing","Processing" "Field Data Type","Field Data Type","Field Data Type","Field Data Type","Field Data Type" timestamp,record number,field data,field data,field data, FIGURE 2.4.1 Header Information 2.
Section 2. Data Storage and Retrieval Field Name The name of the field in the data table. This name is created by the CR5000 by appending underscore ( _ ) and a three character mnemonic for the output processing. Field Units The units for the field in the data table. Units are assigned in the program with the units declaration. Field Processing The output processing that was used when the field was stored.
Section 2. Data Storage and Retrieval The following is an example of how the above data might look when imported into a spread sheet. TOA5 Bob's9K TIMESTAMP TS RECORD RN 1995-09-19 14:31:43.84 1995-09-19 14:31:43.85 458 459 CR5000 1048575 1.00 EXPLDAT. 4339 Temp DLD RefTemp_Avg TC_Avg(1) TC_Avg(2) TC_Avg(3) TC_Avg(4) degC degC degC degC degC Avg Avg Avg Avg Avg 29.94 25.6 25.36 25.48 25.4 29.93 25.6 25.36 25.41 25.
Section 2. Data Storage and Retrieval stamped, allowing the calculation of time stamps for their records. If there is a lapse in periodic interval records that does not occur on a frame boundary, an additional time stamp is written within the frame and its occurrence noted in the frame boundary. This additional time stamp takes up space that would otherwise hold data.
Section 2. Data Storage and Retrieval This is a blank page.
Section 3. CR5000 Measurement Details 3.1 Analog Voltage Measurement Sequence The CR5000 measures analog voltages with either an integrate and hold or a sample and hold analog to digital (A/D) conversion. The A/D conversion is made with a 16 bit successive approximation technique which resolves the signal voltage to approximately one part in 60,000 of the full scale range. The maximum conversion rate is 5000 per second or one measurement every 200 µs (10,000 measurements per second on a single channel).
Section 3. CR5000 Measurement Details An AutoRange measurement will return Not-A-Number if the voltage exceeds the range picked by the first measurement. To avoid problems with a signal on the edge of a range, AutoRange selects the next larger range when the signal exceeds 90% of a range.
Section 3. CR5000 Measurement Details 3.1.4 SettlingTime When the CR5000 switches to a new channel or switches on the excitation for a bridge measurement, there is a finite amount of time required for the signal to reach its true value. Delaying between setting up a measurement (switching to the channel, setting the excitation) and making the measurement allows the signal to settle to the correct value.
Section 3. CR5000 Measurement Details multiple of 500 µs, the CR5000 will repeat 250 µs integration measurements every 500 µs throughout the integration interval. If the integration time specified is 100 µs or 200 µs, the CR5000 makes one or two samples in the integration interval. The average of these measurements is stored as the result of the measurement. The random noise level is decreased by the square root of the number of measurements made.
Section 3. CR5000 Measurement Details be made. For example, if the high side of a differential input is at 4 V and the low side is at 3 V relative to CR5000 ground, there is no problem. A measurement made on the ±5000 mV range will return 1000 mV. However, if the high input is at 5.8 V and the low input is at 4.8 V, the measurement can not be made because the high input is outside of the ±5 V common mode range (the CR5000 will indicate the overrange by returning not-a-number (NAN)).
Section 3. CR5000 Measurement Details 1. The signal must rise to its correct value. 2. A small transient caused by switching the analog input into the measurement circuitry must settle. 3. When a resistive bridge measurement is made using a switched excitation channel, a larger transient caused when the excitation is switched must settle. 3.3.1 Minimizing Settling Errors When long lead lengths are mandatory, the following general practices can be used to minimize or measure settling errors: 1.
Section 3. CR5000 Measurement Details measurements are repeated on the same channel the settling time is only necessary before the first measurement (as long as the excitation polarity and differential inputs are not reversed). Before the program to measure the settling time is run, the sensor with the cable that will be used in the installation needs to be connected and the sensor needs to be stabilized.
Section 3. CR5000 Measurement Details junction, which becomes the reference junction, is formed where the other ends of the wires are connected to the measuring device. (With the connectors at the same temperature, the chemical dissimilarity between the thermocouple wire and the connector does not induce any voltage.
Section 3. CR5000 Measurement Details 0.3 0.25 Thermistor Tolerance ºC 0.2 0.15 0.1 0.05 0 -60 -50 -40 -30 -20 -10 0 10 20 30 40 50 60 70 80 90 100 Temperature ºC FIGURE 3.4-1. Thermistor Tolerance The error in the reference temperature measurement is a combination of the error in the thermistor temperature and the difference in temperature between the panel thermistor and the terminals the thermocouple is connected to.
Section 3. CR5000 Measurement Details thermal mass of the batteries. Note that the smallest errors are on channels 5 and 16 in the middle of the terminal strips closest to the thermistor.
Section 3. CR5000 Measurement Details Reference Temperature Errors Due to Panel Gradient Chamber Changed From 80 to 25 °C at 1.3 °C/Minute 80 1.4 Channel 1 Channel 5 Channel 10 Channel 11 Channel 16 Channel 20 Panel Chamber 1 Measured - Actual (°C) 0.8 70 60 0.6 50 0.4 40 0.2 0 Chamber and CR5000 Panel Temperature (°C) 1.2 30 -0.2 95 90 85 80 75 70 65 60 55 50 45 40 35 30 25 20 15 10 5 0 20 -5 -0.4 Time (minutes) FIGURE 4.3-3.
Section 3. CR5000 Measurement Details When both junctions of a thermocouple are at the same temperature there is no voltage produced (law of intermediate metals). A consequence of this is that a thermocouple can not have an offset error; any deviation from a standard (assuming the wires are each homogeneous and no secondary junctions exist) is due to a deviation in slope. In light of this, the fixed temperature limits of error (e.g., ±1.0 °C for type T as opposed to the slope error of 0.
Section 3. CR5000 Measurement Details requiring the ±200 mV input range. At 1300 oC, a K thermocouple outputs 34.9 µV per oC. The possible slope error in the voltage measurement is 0.00075x52 mV = 39 µV or 1.12 oC (39/34.9). The basic resolution on the 200 mV range is 6.67 µV or 0.19 oC. Thus, the possible error due to the voltage measurement is 1.56 oC on a non-reversing differential, or 1.31 oC with a reversing differential measurement. TABLE 3.4-2.
Section 3. CR5000 Measurement Details TABLE 3.4-3. Limits of Error on CR5000 Thermocouple Polynomials (Relative to NIST Standards) TC Type T Range oC Limits of Error oC -270 -270 -200 -100 100 to to to to to 400 -200 -100 100 400 + ± ± ± J -150 -100 to to 760 300 ± 0.008 ± 0.002 E -240 -240 -130 200 to to to to 1000 -130 200 1000 ± 0.4 ± 0.005 ± 0.02 -50 -50 950 to to to 1372 950 1372 ± 0.01 ± 0.04 K 18 @ -270 0.08 0.001 0.
Section 3. CR5000 Measurement Details TABLE 3.4-4. Reference Temperature Compensation Range and Polynomial Error Relative to NIST Standards TC Type Range oC Limits of Error oC T J E K -100 to 100 -150 to 296 -150 to 206 -50 to 100 ± 0.001 ± 0.005 ± 0.005 ± 0.
Section 3. CR5000 Measurement Details the box to the CR5000. Alternatively, the junction box can be used to couple extension grade thermocouple wire to the thermocouples, and the CR5000 panel temperature used as the reference. Extension grade thermocouple wire has a smaller temperature range than standard thermocouple wire, but meets the same limits of error within that range.
Section 3. CR5000 Measurement Details 3.5 Bridge Resistance Measurements There are six bridge measurement instructions included in the standard CR5000 software. Figure 3.5-1 shows the circuits that would typically be measured with these instructions. In the diagrams, the resistors labeled Rs would normally be the sensors and those labeled Rf would normally be fixed resistors. Circuits other than those diagrammed could be measured, provided the excitation and type of measurements were appropriate.
Section 3.
Section 3. CR5000 Measurement Details 3.6 Measurements Requiring AC Excitation Some resistive sensors require AC excitation. These include electrolytic tilt sensors, soil moisture blocks, water conductivity sensors and wetness sensing grids. The use of DC excitation with these sensors can result in polarization, which will cause an erroneous measurement, and may shift the calibration of the sensor and/or lead to its rapid decay.
Section 3. CR5000 Measurement Details for excitation; because it is encircled by the ground electrode, the path for a ground loop through the soil is greatly reduced. Moisture blocks which consist of two parallel plate electrodes are particularly susceptible to ground loop problems. Similar considerations apply to the geometry of the electrodes in water conductivity sensors.
Section 3. CR5000 Measurement Details The resolution gets much worse with the shorter intervals used with higher speed measurements. As an example, assume that engine RPM is being measured from a signal that outputs 30 pulses per revolution. At 2000 RPM, the signal has a frequency of 100 Hz (2000 RPMx(1 min/60 s)x30=1000). The multiplier to convert from frequency to RPM is 2 RPM/Hz (1 RPM/(30 pulses/60s) = 2). At a 1 second scan interval, the resolution is 2 RPM.
Section 3. CR5000 Measurement Details background calibration will be disabled (even if the scan is not executed). The calibrate instruction is described in Section 7. The self calibration does not take place if there is not enough time to run it or if the calibrate instruction is in the CR5000 program and never executed. Without the self calibration the drift in accuracy with temperature is about a factor of 10 worse.
Section 4. CRBasic - Native Language Programming The CR5000 is programmed in a language that has some similarities to a structured basic. There are special instructions for making measurements and for creating tables of output data. The results of all measurements are assigned variables (given names). Mathematical operations are written out much as they would be algebraically. This section describes a program, its syntax, structure, and sequence. 4.1 Format Introduction 4.1.
Section 4. CRBasic - Native Language Programming PanelTemp is the keyword name of the instruction. The two parameters associated with PanelTemp are: Destination, the name of the variable in which to put the temperature; and Integration, the length of time to integrate the measurement.
Section 4. CRBasic - Native Language Programming Define Subroutines Program Set scan interval If there is a process or series of calculations that need to be repeated several times in the program, it can be packaged in a subroutine and called when needed rather than repeating all the code each time.
Section 4. CRBasic - Native Language Programming 4.3 Example Program Const RevDiff=1 Const Del=0 'default Const Integ=250 Const Mult=1 Const Offset=0 Declare constants Public RefTemp Public TC(6) Units RefTemp=degC Units TC=DegC Declare public variables , dimension array, and declare units.
Section 4. CRBasic - Native Language Programming = degC). The units are strictly for the user's documentation; the CR5000 makes no checks on their accuracy. The above table is the result of the data table description in the example program: DataTable (Temp,1,2000) DataInterval(0,10,msec,10) Average(1,RefTemp,fp2,0) Average(6,TC(1),fp2,0) EndTable All data table descriptions begin with DataTable and end with EndTable.
Section 4. CRBasic - Native Language Programming Average(Reps, Source, DataType, DisableVar) Average(1,RefTemp,fp2,0) Average(6,TC(1),fp2,0) Average is an output processing instruction that will output the average of a variable over the output interval. The parameters are repetitions - the number of elements in an array to calculate averages for, the Source variable or array to average, the data format to store the result in (Table 4.
Section 4. CRBasic - Native Language Programming forever (or until ExitScan). In the example the scan is 1 millisecond, three scans are buffered, and the measurements and output continue indefinitely. 4.4 Numerical Entries In addition to entering regular base 10 numbers there are 3 additional ways to represent numbers in a program: scientific notation, binary, and hexadecimal (Table 4.4-1). TABLE 4.4-1 Formats for Entering Numbers in CRBasic Format Example Value Standard 6.832 6.
Section 4. CRBasic - Native Language Programming 4.5.2 Expression Evaluation Conditional tests require the CR5000 to evaluate an expression and take one path if the expression is true and another if the expression is false. For example: If X>=5 then Y=0 will set the variable Y to 0 if X is greater than or equal to 5. The CR5000 will also evaluate multiple expressions linked with and or or. For example: If X>=5 and Z=2 then Y=0 will only set Y=0 if both X>=5 and Z=2 are true.
Section 4. CRBasic - Native Language Programming 4.7 Parameter Types Instructions parameters allow different types of inputs these types are listed below and specifically identified in the description of the parameter in the following sections or in PC9000 CRBasic help. Constant Variable Variable or Array Constant, Variable, or Expression Constant, Variable, Array, or Expression Name Name or list of Names Variable, or Expression Variable, Array, or Expression Table 4.
Section 4. CRBasic - Native Language Programming calibrated sensors, applying the correct calibration to each sensor. If the multiplier and offset are not arrays, the same multiplier and offset are used for each repetition. VoltSE(Dest,Reps,Range,ASlot,SEChan,Delay, Integ,Mult,Offset) 'Calibration factors: Mult(1)=0.123 : Offset(1)= 0.23 Mult(2)=0.115 : Offset(2)= 0.234 Mult(3)=0.114 : Offset(3)= 0.224 VoltSE(Pressure(),3,mV1000,6,1,1,100,Mult(),Offset() 4.
Section 4. CRBasic - Native Language Programming Tablename.eventend(1,1) is only valid for a data table using the DataEvent instruction, Tablename.eventend(1,1) = 1 if the last record of an event occurred the last time the table was called, = 0 if the data table did not store a record or if it is in the middle of an event. NOTE The values of Tablename.output(1,1) and Tablename.eventend (1,1) are only updated when the tables are called. The WorstCase example in Section 6.
Section 4. CRBasic - Native Language Programming This is a blank page.
Section 5. Program Declarations Alias Used to assign a second name to a variable. Syntax Alias VariableA = VariableB Remarks Alias allows assigning a second name to a variable. Within the datalogger program, either name can be used. Only the alias is available for Public variables. The alias is also used as the root name for data table fieldnames. With aliases the program can have the efficiency of arrays for measurement and processing yet still have individually named measurements.
Section 5. Program Declarations Const Declaration Example The example uses Const to define the symbolic constant PI. Const PI = 3.141592654 Dim Area, Circum, Radius Radius = Volt( 1 ) Circum = 2 * PI * Radius Area = PI * ( Radius ^ 2 ) 'Define constant. 'Declare variables. 'Get measurement. 'Calculate circumference. 'Calculate area. Dim Declares variables and allocates storage space. In CRBasic, ALL variables MUST be declared.
Section 5. Program Declarations Public Declaration Example The example shows the use of the Public declaration. Dim x( 3 ), y, z( 2, 3, 4 ) Public x, y, z Public Dim x( 3 ), y, z( 2, 3, 4 ) Public x( 3 ),y, z( 2, 3, 4 ) Public w 'Dim is optional Station Name Sets the station name. Syntax StationName StaName Remarks StationName is used to set the datalogger station name with the program. The station name is displayed by PC9000 and stored in the data table headers (Section 2.4).
Section 5. Program Declarations The Sub statement has these parts: Part Description Sub Marks the beginning of a Subroutine. SubName Name of the Subroutine. Because Subroutine names are recognized by all procedures in all modules, subname cannot be the same as any other globally recognized name in the program. VariableList List of variables that are passed to the Subroutine when it is called.
Section 5.
Section 5. Program Declarations This is a blank page.
Section 6. Data Table Declarations and Output Processing Instructions 6.1 Data Table Declaration DataTable (Name, TrigVar, Size) output trigger modifier export data destinations output processing instructions EndTable DataTable is used to declare/define a data table. The name of the table, output trigger and size of the table in RAM are set with DataTable. The Table declaration must be at the beginning of the code prior to BeginProg. The table declaration starts with DataTable and ends with EndTable.
Section 6. Data Table Declarations and Output Processing Instructions 6.2 Trigger Modifiers DataInterval (TintoInt, Interval, Units, Lapses) Used to set the time interval for an output table. DataInterval is inserted into a data table declaration following the DataTable instruction to establish a fixed interval table. The fixed interval table requires less memory than a conditional table because time is not stored with each record.
Section 6. Data Table Declarations and Output Processing Instructions Parameter & Data Type TintoInt Constant Interval Constant Units Constant Lapses Constant Enter The time into the interval (offset to the interval) at which the table is to be output. The units for time are the same as for the interval. Enter the time interval on which the data in the table is to be recorded. The interval may be in µs, ms, s, or minutes, whichever is selected with the Units parameter.
Section 6.
Section 6. Data Table Declarations and Output Processing Instructions DataEvent Example: In this example, 5 type T thermocouples are measured. The trigger for the start of an event is when TCTemp(1) exceeds 30 degrees C. The stop trigger is when TCTemp(1) less than 29 degrees C. The event consists of 20 records prior to the start trigger and continues to store data until 10 records following the stop trigger.
Section 6. Data Table Declarations and Output Processing Instructions WorstCase (TableName, NumCases, MaxMin, Change, RankVar) Allows saving the most significant or “ worst-case” events in separate data tables. A data table is created that is sized to hold one event. This table acts as the event buffer. Each event that occurs is stored to this table. This table may use the DataEvent instruction or some other condition to determine when an event is stored.
Section 6. Data Table Declarations and Output Processing Instructions WorstCase Example This program demonstrates the Worst Case Instruction. Five type T thermocouples are measured. The event is similar to that in the example for the DataEvent instruction; the trigger for the start of a data event is when TC(1) exceeds 30 degrees C. However in this example, the stop trigger is set immediately true. This is done to set a fixed size for the event which can be duplicated in the worst case tables.
Section 6. Data Table Declarations and Output Processing Instructions 6.3 Export Data Instructions CardOut (StopRing, Size) Used to send output data to the PCMCIA card. This instruction creates a data table on the PCMCIA card. CardOut must be entered within each data table declaration that is to store data on a PCMCIA card. Parameter & Data Type StopRing Constant Size Constant Enter A code to specify if the Data Table on the PCMCIA card is fill and stop or ring (newest data overwrites oldest).
Section 6. Data Table Declarations and Output Processing Instructions Data transfer to the transmitter can occur via the datalogger's CS I/O port only. The GOESData instruction has the following parameters: NOTE Parameter & Data Type Dest Variable or Array Table Table Name TableOption Constant BufferControl Constant When the datalogger sends a command, further processing tasks will be performed only after a response has been received from the HDR GOES Transmitter.
Section 6. Data Table Declarations and Output Processing Instructions Parameter & Data Type DataFormat Constant Enter The DataFormat parameter specifies the format of the data sent to the transmitter Code Description 0 CSI FP2 data; 3 bytes per data point 1 Floating point ASCII; 7 bytes per data point 2 18-bit binary integer; 3 bytes per data point, numbers to the right of the decimal are truncated 3 RAWS7; 7 data points: Data Point Description 1 total rainfall in inches, format = xx.
Section 6. Data Table Declarations and Output Processing Instructions Parameter & Data Type Enter StatusComma nd The StatusCommand specifies the type of information requested from the transmitter. Constant Code 0 1 2 3 4 5 6 Description Read time Status Last message status Transmit random message Read error register Reset error register Return transmitter to online mode Array Dim Required 4 13 14 1 10 1 1 6.
Section 6. Data Table Declarations and Output Processing Instructions n is the number of values processed over the output interval and X i and Yi are the individual values of X and Y . where Parameter& Data Type NumVals Constant Source Variable Array Enter DataType A code to select the data storage format. Alpha Code Numeric Code Data Format IEEE4 24 IEEE 4 byte floating point FP2 7 Campbell Scientific 2 byte floating point A non-zero value will disable intermediate processing.
Section 6. Data Table Declarations and Output Processing Instructions Parameter & Data Type Units Constant Options Constant Enter The units for Tau. Alpha Numeric Code Code Units USEC 0 microseconds MSEC 1 milliseconds SEC 2 seconds MIN 3 minutes A code to indicate what values to calculate and output. Code Result 0 FFT. The output is N/2 complex data points, i.e., the real and imaginary parts of the FFT. The first pair is the DC component and the Niquist component.
Section 6. Data Table Declarations and Output Processing Instructions Notes: • Power is independent of the sampling rate (1/tau) and of the number of samples (N). • The PSD is proportional to the length of the sampling period (T=N*tau), since the “ width” of each bin is 1/T. • The sum of the AC bins (excluding DC) of the Power Spectrum is the Variance (AC Power) of the time series.
Section 6. Data Table Declarations and Output Processing Instructions DataTable(IFFT,1,1) 'inverse FFT fft(y,IEEE4,SIZE_FFT,10 msec,5) EndTable BeginProg Scan(10, msec,0,SIZE_FFT) i=i+1 X(i) = DC + Sin(PI/8+2*PI*CYCLESperT*i/SIZE_FFT) * AMPLITUDE + Sin(PI/2+PI*i) Next Scan CallTable(Amp) CallTable(AmpPhase) CallTable(Power) CallTable(PSD) CallTable(FFT) for i = 1 to SIZE_FFT y(i) = FFT.
Section 6. Data Table Declarations and Output Processing Instructions Sample(4, Temp(1), IEEE4) FieldNames “ IntakeT(2)” The 4 values from the variable array Temp are stored in the output table with IntakeT,an array of 2, and the remainder of the default array Temp: IntakeT(1), IntakeT(2), Temp(3), and Temp(4), Histogram (BinSelect, DataType, DisableVar, Bins, Form, WtVal, LoLim, UpLim) Processes input data as either a standard histogram (frequency distribution) or a weighted value histogram.
Section 6.
Section 6. Data Table Declarations and Output Processing Instructions Histogram4D (BinSelect, Source, DataType, DisableVar, Bins1, Bins2, Bins3, Bins4, Form, WtVal, LoLim1, UpLim1, LoLim2, UpLim2, LoLim3, UpLim3, LoLim4, UpLim4) Processes input data as either a standard histogram (frequency distribution) or a weighted value histogram of up to 4 dimensions. The description of the Histogram instruction also applies to the Histogram4D instruction.
Section 6. Data Table Declarations and Output Processing Instructions LevelCrossing (Source, DataType, DisableVar, NumLevels, 2ndDim, CrossingArray, 2ndArray, Hysteresis, Option) Parameter & Data Type Source Variable or Array Enter DataType A code to select the data storage format. Alpha Code Numeric Code Data Format IEEE4 24 IEEE 4 byte floating point FP2 7 Campbell Scientific 2 byte floating point A non-zero value will disable intermediate processing. Normally 0 is entered so all inputs are processed.
Section 6. Data Table Declarations and Output Processing Instructions Processes data with the Level Crossing counting algorithm. The output is a two dimensional Level Crossing Histogram. One dimension is the levels crossed; the second dimension, if used, is the value of a second input at the time the crossings were detected. The total number of bins output = NumLevels*2ndDim. For a one dimensional level crossing histogram, enter 1 for 2ndDim.
Section 6. Data Table Declarations and Output Processing Instructions Point Source Action 1 0.5 2 1.2 3 1.4 4 0.3 5 3.3 First value, no counts Add one count to first bin, the signal crossed 1 No levels crossed, no counts Crossed a level but was falling edge, no counts Add one count to first, second, and third bins, the signal crossed 1, 1.5 and 3. Bin 1 (level=1) 0 Bin 2 (level=1.
Section 6. Data Table Declarations and Output Processing Instructions Point 1 2 Crossing Source 0.5 1.2 2nd Dim Source .7 1.8 Action First value, no counts Add one count to first crossing, second 2D bin, the signal crossed 1 Histogram: Cross 1 Cross 1.5 Cross 3 2D < 1.25 0 0 0 3 4 1.4 0.3 .7 .7 5 3.3 2.7 1.25<2D<2.25 1 0 0 2.25<2D<3.
Section 6. Data Table Declarations and Output Processing Instructions The hysteresis determines the minimum change in the input that must occur before a crossing is counted. If the value is too small, “ crossings” could be counted which are in reality just noise. For example, suppose 5 is a crossing level. If the input is not really changing but is varying from 4.999 to 5.001, a hysteresis of 0 would allow all these crossings to be counted. Setting the hysteresis to 0.
Section 6. Data Table Declarations and Output Processing Instructions Parameter & Data Type DataType Constant DisableVar Constant, Variable, or Expression Time Constant Enter A code to select the data storage format. Alpha Code Numeric Code Data Format IEEE4 24 IEEE 4 byte floating point FP2 7 Campbell Scientific 2 byte floating point A non-zero value will disable intermediate processing. Normally 0 is entered so all inputs are processed.
Section 6. Data Table Declarations and Output Processing Instructions Parameter & Data Type Form Enter The Form code is 3 digits - ABC Constant Code Form A=0 Reset histogram after each output. A=1 Do not reset histogram. B=0 Divide bins by total count. B=1 Output total in each bin. C=0 Open form. Include outside range values in end bins. C=1 Closed form. Exclude values outside range. 101 means: Do not reset. Divide bins by total count. Closed form.
Section 6. Data Table Declarations and Output Processing Instructions C1,1 C1,2 . . . C1,N C2,1 C2,2 . . . C2,N . . . . . . . CM,1 CM,2 . . . . . . . . CM,N The histogram can have either open or closed form. In the open form, a cycle that has an amplitude larger than the maximum bin is counted in the maximum bin; a cycle that has a mean value less than the lower limit or greater than the upper limit is counted in the minimum or maximum mean bin.
Section 6. Data Table Declarations and Output Processing Instructions Parameter & Data Type Reps Constant Source Enter The number of standard deviations to calculate. When repetitions are greater than 1, the source must be an array. The name of the Variable that is the input for the instruction. Variable DataType Constant DisableVar Constant, Variable, or Expression A code to select the data storage format.
Section 6. Data Table Declarations and Output Processing Instructions Parameter & Data Type Repetitions Constant Speed/East Dir/North Variables or Arrays DataType Constant DisableVar Constant, Variable, or Expression Subinterval Constant SensorType Constant OutputOpt Constant Enter The name of the data table to clone. The length of this name should be 4 characters or less so the complete names of the worst case tables are retained when collected (see NumCases).
Section 6. Data Table Declarations and Output Processing Instructions When used with polar sensors, the instruction does a modulo divide by 360 on wind direction, which allows the wind direction (in degrees) to be 0 to 360, 0 to 540, less than 0, or greater than 540. The ability to handle a negative reading is useful where a difficult to reach wind vane is improperly oriented. For example, a vane outputs 0 degrees at a true reading of 340 degrees.
Section 6. Data Table Declarations and Output Processing Instructions Calculations: North sn U Θu s4 s1 s2 s3 East FIGURE 6.4-2. Input Sample Vectors In Figure 6.4-2, the short, head-to-tail vectors are the input sample vectors described by si and Θ i , the sample speed and direction, or by Uei and Uni, the east and north components of the sample vector. At the end of output interval T, the sum of the sample vectors is described by a vector of magnitude U and direction Θu.
Section 6. Data Table Declarations and Output Processing Instructions Resultant mean horizontal wind speed, U : 2 2 1/2 U =(Ue +Un ) Un U Ue FIGURE 6.4-3.
Section 6. Data Table Declarations and Output Processing Instructions For deviations less than 40 degrees, the error in this approximation is less than 1%. At deviations of 60 degrees, the error is 10%.
Section 7. Measurement Instructions 7.1 Voltage Measurements VoltDiff – Differential Voltage Measurement............................................. 7-3 VoltSE – Single-ended Voltage Measurement ............................................ 7-3 7.2 Thermocouple Measurements Measure the Output of Thermocouples and Convert to Temperature. TCDiff – Differential Voltage Measurement of Thermocouple .................. 7-3 TCSE – Single-ended Voltage Measurement of Thermocouple..................
Section 7. Measurement Instructions 7.8 Digital I/O PeriodAvg - Measures the period or the frequency of a signal on a single-ended channel.......................................................................... 7-19 PortGet - Reads the status of one of the eight control ports....................... 7-21 PortSet – Sets Digital Ports........................................................................ 7-22 PulseCount – Pulse/Frequency Measurement............................................
Section 7. Measurement Instructions 7.1 Voltage Measurements VoltDiff (Dest, Reps, Range, DiffChan, RevDiff, SettlingTime, Integ, Mult, Offset) Diff. Chanel H Sensor Diff. Chanel L. This instruction measures the voltage difference between the HI and Low inputs of a differential channel. Both the high and low inputs must be within ± 5V of the datalogger's ground (See Common Mode Range, Section 3.2).
Section 7. Measurement Instructions TCSE (Dest, Reps, Range, SEChan, TCType, TRef, MeasOfs, SettlingTime, Integ, Mult, Offset) S.E. Chanel Ground Thermocouple This instruction measures a thermocouple with a single-ended voltage measurement and calculates the thermocouple temperature (°C) for the thermocouple type selected. The instruction adds the measured voltage to the voltage calculated for the reference temperature relative to 0° C, and converts the combined voltage to temperature in °C.
Section 7. Measurement Instructions Parameter & Data Type RevDiff Constant MeasOfs Constant SettlingTime Constant Integ Constant Mult, Offset Constant, Variable, Array, or Expression Enter Result (Reversing requires twice as much time to complete) Signal is measured with the high side referenced to the low A second measurement is made after reversing the inputs to cancel offsets Code Value Result the Ground offset voltage is subtracted from single ended measurements.
Section 7. Measurement Instructions BrHalf3W (Dest, Reps, Range, SEChan, ExChan, MeasPEx, ExmV, RevEx, SettlingTime, Integ, Mult, Offset) X = result w/mult = 1, offset = 0 X= 2V2 − V1 Rs = Vx − V1 Rf This Instruction is used to determine the ratio of the sensor resistance to a known resistance using a separate voltage sensing wire from the sensor to compensate for lead wire resistance.
Section 7. Measurement Instructions Half Bridge Parameters Parameter & Data Type Dest Variable or Array Reps Enter The Variable in which to store the results of the instruction. When Reps are used the results are stored in an array with the variable name. An array must be dimensioned to have elements for all the Reps. The number of repetitions for the measurement or instruction.
Section 7. Measurement Instructions Parameter & Data Type SettlingTime Constant Integ Constant Mult, Offset Enter The time in microseconds to delay between setting up a measurement (switching to the channel, setting the excitation) and making the measurement.
Section 7. Measurement Instructions BrFull6W (Dest, Reps, Range1, Range2, DiffChan, ExChan, MeasPEx, ExmV, RevEx, RevDiff, SettlingTime, Integ, Mult, Offset) X = result w/mult = 1, offset = 0 X = 1000 ⎛ R3 V2 R2 ⎞ = 1000⎜ − ⎟ V1 ⎝ R3 + R4 R1 + R2 ⎠ This Instruction applies an excitation voltage and makes two differential voltage measurements. The measurements are made on sequential channels. The result is the voltage measured on the second channel (V2) divided by the voltage measured on the first (V1).
Section 7. Measurement Instructions Parameter & Data Type ExChan Constan MeasPEx Constant ExmV Constant RevEx Constant RevDiff Constant SettlingTime Constant Integ Constant Mult, Offset Constant, Variable, Array, or Expression 7-10 Enter Enter the excitation channel number to excite the first measurement. Alpha Code/ Result Code Channel VX1 1 Switched excitation channels, are switched to the excitation voltage. VX2 2 for the measurement and switched off between measurements.
Section 7. Measurement Instructions 7.5 Current Excitation Resistance (Dest, Reps, Range, DiffChan, IxChan, MeasPEx, ExuA, RevEx, RevDiff, SettlingTime, Integ, Mult,Offset) The Resistance instruction applies a precision current excitation and measures a differential voltage. The result is the measured voltage divided by the excitation current. The measurement can be used to measure resistance or, with some sensors, to provide a current excitation for measuring a full bridge.
Section 7.
Section 7. Measurement Instructions Parameter & Data Type SettlingTime Constant Integ Constant Mult, Offset Enter The time in microseconds to delay between setting up a measurement (switching to the channel, setting the excitation) and making the measurement.
Section 7. Measurement Instructions Parameter & Data Type CAOChan Constant CAOmV Constant or Variable Boost Constant FastUpdate Enter The CAO channel to set. Alpha Numeric Description CAO1 1 CAO channel 1 CAO2 2 CAO channel 2 The voltage, in millivolts, to apply to the CAO Channel. The allowable range is ±5000 mV. The voltage can be constant or a variable can be used to vary the analog output in response to time or measurements.
Section 7. Measurement Instructions Parameter & Data Type ExChan Constan ExmV Constant XDelay Enter Enter the excitation channel number to excite the first measurement. Alpha Code/ Result Code Channel VX1 1 Switched excitation channels, are switched to the excitation voltage. VX2 2 for the measurement and switched off between measurements. VX3 3 VX4 4 The excitation voltage in millivolts. Allowable range ± 5000 mV.
Section 7. Measurement Instructions Calibrate (Dest, AllRanges) The Calibrate instruction places the CR5000 self calibration under program control. Placing the Calibrate instruction in the program disables the automatic self calibration that is normally run in the background (Section 3.8). The Calibrate parameters are optional and are only used to place the results of the calibration in a variable array. With no parameters the Calibrate instruction does not return data.
Section 7. Measurement Instructions Unless the AllRanges option is selected, the calibrate instruction only measures the range and integration combinations that occur in the measurements in the program. For the 250 µs and zero integration calibrations multiple measurements are averaged for the calibration values. The 250 µs integration calibration averages five measurements and the zero integration calibration averages ten measurements.
Section 7.
Section 7. Measurement Instructions 7.8 Digital I/O PeriodAvg (Dest, Reps, Range, SEChan, Threshold, PAOption, Cycles, Timeout, Mult, Offset) This instruction measures the period of a signal on any single-ended input channel. The specified number of Cycles are timed with a resolution of 70 ns, making the resolution of the period measurement 70 ns divided by the number of Cycles chosen. Parameter & Data Type Dest Variable or Array Reps Enter The Variable in which to store the results of the instruction.
Section 7. Measurement Instructions is not recommended for small amplitude sensor signals. For sensor amplitudes less than 20 mV pk-pk a dc blocking capacitor, see Figure 7.8-1, is recommended to center the signal at CR5000 ground (threshold = 0) because of offset voltage drift along with limited accuracy (± 10 mV) and resolution (1.2 mV) of a threshold other than 0. The minimum pulse width requirements increase (maximum frequency decreases) with increasing gain as shown in range parameter.
Section 7. Measurement Instructions The back-to-back silicon diodes D1 and D2 provide ESD protection of capacitor C and the sensor, and also limit the amplitude of large amplitude sensor signals. These diodes clip large amplitude signals to approximately 1.4 V pk-pk which is within the recommended input signal ranges for all range codes. Diodes D1 and D2 along with resistor R1 are recommended to limit large amplitude sensor signals, even when dc blocking capacitor C is not used.
Section 7. Measurement Instructions Parameter & Data Type Dest Variable Port Constant Enter The variable in which to store the result of the instruction. A 1 is stored if the port is high; 0 is stored if the port is low. The control port number (1-8) for which the status should be obtained. PortGet Example This example uses PortGet to read the status of port 1 at the beginning of each scan.
Section 7. Measurement Instructions PulseCount (Dest, Reps, PChan, PConfig, POption, Mult, Offset) Pulse Channel Sensor Ground Parameter & Data Type Dest Variable or Array Reps Enter The Variable in which to store the results of the instruction. When Reps are used the results are stored in an array with the variable name. An array must be dimensioned to have elements for all the Reps. The number of repetitions for the measurement or instruction.
Section 7. Measurement Instructions CR23X 20k Pi FIGURE 7.8-1. Conditioning Large Voltage Pulses The maximum input voltage on a pulse channel is ±20 V. Refer to Figure 7.8-1 if reducing input voltage is required. • Pulse Channels Maximum Input Voltage: ±20 V CR5000 High Frequency Input • Pulse Channels Minimum Pulse Width: 1.2 microsecond Maximum Frequency: 400 kHz (50% Duty Cycle) Lower Threshold: 1.5 V* Upper Threshold: 3.
Section 7. Measurement Instructions Switch Closure • Pulse Channels A switch closure is connected between P1..P4 and analog ground. When the switch is open, the CR23X pulls the pulse channel to 5 V through a 100 kOhm impedance. When the switch is closed, the pulse channel is pulled to ground. The count is incremented when the switch opens.
Section 7. Measurement Instructions SW12 The SW12 instruction is used to set a Switched 12 volt supply high or low. Syntax SW12( State ) Remarks The datalogger has a switched 12 volt output with two terminals. This switched 12 volts is used to provide a continuous 12 volt supply to external peripherals. At room temperature the switched 12 volt supply can source 900 mA between the SW-12 terminal and Ground. The State parameter indicates whether the switched 12 volts is High (non-zero) or low (0).
Section 7. Measurement Instructions TimerIO The TimerIO instruction is used to measure the time between edges (state transitions) or frequency on the digital I/O ports of the datalogger. The timing resolution is 50 nanoseconds. The longest interval that can be timed is 214.7 seconds (232 x 50 nanoseconds). Syntax TimerIO( Dest, Edges, Function, Timeout, Units) Remarks There are eight control ports on the datalogger.
Section 7. Measurement Instructions Parameter & Data Type Units Enter The Units parameter is used to specify the unit of measure for the timeout period. An alphabetical or numeric code can be entered. Alpha Description Numeric 0 usec microseconds 1 msec milliseconds 2 sec seconds 3 min minutes WriteIO (Mask, Source) WriteIO is used to set the status of selected control I/O channels (ports) on the CR5000. (See Also PortSet.) There are 8 ports.
Section 7. Measurement Instructions 7.9 Peripheral Devices AM25T (Dest, Reps, Range, AM25TChan, DiffChan, TCType, Tref, ClkPort, ResPort, VxChan, RevDiff, SettlingTime, Integ, Mult, Offset) This Instruction controls the AM25T Multiplexer. Parameter & Data Type Dest Variable or Array Enter The Variable in which to store the results of the instruction. When Reps are used the results are stored in an array with the variable name. An array must be dimensioned to have elements for all the Reps.
Section 7. Measurement Instructions Parameter & Data Type SettlingTime Constant Integ Constant Mult, Offset Constant, Variable, Array, or Expression Enter The time in microseconds to delay between setting up a measurement (switching to the channel, setting the excitation) and making the measurement.
Section 7. Measurement Instructions CANBUS (Dest, SDMAddress, TimeQuanta, TSEG1, TSEG2, ID, DataType, StartBit, NumBits, NumVals, Multiplier, Offset) The CANBUS instruction is used to measure and control the SDM-CAN interface. Multiple CANBUS instructions may be used within a program. The initial function of the instruction is to configure the SDM-CAN interface when the datalogger program is compiled.
Section 7. Measurement Instructions Parameter & Data Type TSEG2 Enter The third time segment, TSEG2 (the phase segment two), is defined by the TSEG2 parameter. The value of TSEG2 can be calculated using the equation: TSEG 2 = t TSEG 2 / t q ID DataType The relative values of TSEG1 and TSEG2 determine when the SDM-CAN samples the data bit. Each device on a CAN-bus network prefaces its data frames with an 11 or 29 bit identifier. The ID parameter is used to set this address.
Section 7. Measurement Instructions Parameter & Data Type Enter 18 19 20 21 22 23 24 25 26 27 28 29 30 31 32 Build data frame in SDM-CAN memory; 4-byte IEEE floating point number; least significant byte first. Logical "OR" with existing data. Transmit data value to the CAN-bus; unsigned integer, most significant byte first. Transmit data value to the CAN-bus; unsigned integer, least significant byte first. Transmit data value to the CAN-bus; signed integer, most significant byte first.
Section 7. Measurement Instructions Parameter & Data Type Enter 1 C D 2-9 0 1 2 3-7 8 9 0 1 2 3 4 5 7-34 SDM-CAN returns -99999 if a data value is requested by the datalogger and a new value has not been captured from the network since the last request. Currently not used. Disable I/O interrupts (default). Enable I/O interrupts, pulsed mode. Enable I/O interrupts, fast mode. Currently not used. Place the SDM-CAN into low power stand-by mode Leave switch setting unchanged.
Section 7. Measurement Instructions Parameter & Data Type Enter 6 StartBit NumBits Normal; self-test. The SDM-CAN will perform a successful transmission even if there is no acknowledgment from an external CAN node. Frames received correctly from an external node are acknowledged. 7 Not defined. 8 Not defined. 9 Leave switch setting unchanged. 33 Read SDM-CAN's internal switches. Place results in the array specified in the Dest parameter.
Section 7.
Section 7. Measurement Instructions Parameter & Data Type Source Array Reps Constant SDMAddress Constant Enter The array which holds the values that will be sent to the SDM-CD16AC to enable/disable its ports. An SDM-CD16AC has 16 ports; therefore, the source array must be dimensioned to 16 times the number of Repetitions (the number of SDM-CD16AC devices to be controlled).
Section 7. Measurement Instructions Parameter & Data Type CS7500Cmd Enter The CS7500Cmd parameter requests the data to be retrieved from the sensor. The command is sent first to the device specified by the SDMAddress parameter. If the Reps parameter is greater than 1, subsequent CS7500s will be issued the command with each rep. The results for the command will be returned in the array specified by the Dest parameter.
Section 7. Measurement Instructions Parameter & Data Type Command Rate Enter Commands 90 - 92 send a measurement trigger to the CSAT3 with the SDM address specified by the SDMAddress argument. The CSAT3 also sends data to the datalogger. Options 97 - 99 get data after a group trigger, SDMTrigger(), from the CSAT3 specified by the SDMAddress parameter without triggering a new CSAT3 measurements. The CSAT() instruction must be preceded by the SDMTrigger() instruction in order to used Options 97 - 99.
Section 7. Measurement Instructions Parameter & Data Type Dest Variable or Array Address Constant Config8_5 Config4_1 Constants Funct8_5 Funct4_1 Constants Enter The array where the results of the instruction are stored. For all output options except Capture All Events, the Dest argument should be a one dimensional array with as many elements as there are programmed INT8 channels. If the "Capture All Events" OutputOption is selected, then the Dest array must be two dimensional.
Section 7. Measurement Instructions Parameter & Data Type Enter For example, 4301 in the second function parameter means to return 3 values: the period for channel 1, (nothing for channel 2) the time between an edge on channel 2 and an edge on channel 3, and the time between an edge on channel 1 and an edge on channel 4. The values are returned in the sequence of the channels, 1 to 16. OutputOpt Note: the destination array must be dimensioned large enough to hold all the functions requested.
Section 7. Measurement Instructions Parameter & Data Type CaptureTrig Constant, Variable, or Expression Mult, Offset Constant, Variable, Array, or Expression Enter This argument is used when the "Capture All Events" output option is used. When CaptureTrig is true, the INT8 will return the last nnnn events. A multiplier and offset by which to scale the raw results of the measurement.
Section 7. Measurement Instructions Parameter & Data Type Dest Reps SDMAddress Mode Command Enter The Dest parameter is the variable in which to store the results of the instruction when retrieving data from the SIO4. If data is being sent to the SIO4, then Dest becomes the source array for the data to be sent. The Dest array must be at least as large as the Reps parameter value multiplied by the ValuesPerRep parameter value.
Section 7. Measurement Instructions Parameter & Data Type Param1 Param2 ValuesPerRep Mult, Offset Enter 2049 Communication parameters. 2054 Set up receive filter. 2304 Transmit string and/or data to device (formatter/filter). 2305 Transmit bytes. Param1 is the first parameter that should be passed on to the SIO4 for the selected Command. Refer to the SDM-SIO4 manual for details. Param2 is the second parameter that should be passed on to the SIO4 for the selected Command.
Section 7. Measurement Instructions Parameter & Data Type StartChan Constant Mult, Offset Constant, Variable, Array, or Expression Enter The first channel that should be read on the SW8A. If the Reps parameter is greater than 1, measurements will be made on sequential channels. A multiplier and offset by which to scale the raw results of the measurement. See the measurement description for the units of the raw result; a multiplier of one and an offset of 0 are necessary to output in the raw units.
Section 7. Measurement Instructions This is a blank page.
Section 8. Processing and Math Instructions Operators ^ * / + = <> > < >= <= Raise to Power Multiply Divide Add Subtract Equals Not Equal Greater Than Less Than Greater Than or Equal Less Than or Equal ABS (Source) Returns the absolute value of a number. Syntax x = ABS (source) Remarks Source can be any valid numeric expression. The absolute value of a number is its unsigned magnitude. For example, ABS(-1) and ABS(1) both return 1.
Section 8. Processing and Math Instructions ACOS (Source) The ACOS function returns the arc cosine of a number. Syntax x = ACOS (source) Remarks The source can be any valid numeric expression that has a value between -1 and 1 inclusive. The ACOS function takes the ratio of two sides of a right triangle and returns the corresponding angle. The ratio is the length of the side adjacent to the angle divided by the length of the hypotenuse.
Section 8. Processing and Math Instructions If bit in expr1 is 0 0 1 1 And bit in expr2 is is 0 0 1 0 0 0 1 1 The result And Operator Example The example assigns a value to Msg that depends on the value of variables A, B, and C, assuming that no variable is a Null. If A = 10, B = 8, and C = 6, both expressions evaluate True. Because both expressions are True, the And expression is also True.
Section 8. Processing and Math Instructions ATN (Source) Returns the arctangent of a number. Syntax x = ATN (source) Remarks Source can be any valid numeric expression. The Atn function takes the ratio of two sides of a right triangle and returns the corresponding angle. The ratio is the length of the side opposite the angle divided by the length of the side adjacent to the angle. The result is expressed in radians and is in the range -π/2 to π/2 radians.
Section 8. Processing and Math Instructions Pi/2 +y +x -x 0 Pi -y -Pi/2 ATN2 is the inverse trigonometric function of TAN, which takes an angle as its argument and returns the ratio of two sides of a right triangle. Do not confuse ATN2 with the cotangent, which is the simple inverse of a tangent (1/tangent). ATN2 Function Example The example uses ATN2 to calculate π. By definition, a full circle is 2π radians. ATN2(1,1) is π/4 radians (90 degrees). Dim Pi 'Declare variables.
Section 8. Processing and Math Instructions Parameter & Data Type Dest Variable Swath Constant Source Array Enter The variable in which to store the results of the instruction. The number of values of the source array to average. The name of the variable array that is the input for the instruction. Average Spatial Output Example This example uses AvgSpa to find the average value of the five elements Temp(6) through Temp(10) and store the result in the variable AvgTemp.
Section 8. Processing and Math Instructions Example BeginProg 'Program begins here Scan( RATE, RUNITS, 0, 0 ) 'Scan 1(mSecs), '______________________ Volt Blocks ______________________ VoltDiff(HiVolts, VREP1, VRNG1, 5, 1, 0, VDLY1, VINT1, VMULT1, VOSET1) AvgRun(AvgOut,1,HiVolts,100 ) 'Put the average of 100 HiVolts in AvgOut CallTable MAIN 'Go up and run Table MAIN Next Scan 'Loop up for the next scan EndProg 'Program ends here Cos (Source) Returns the cosine of an angle specified in radians.
Section 8. Processing and Math Instructions Public Volt1, Ans 'Declare variables. BeginProg Scan (1,Sec,3,0) VoltDiff (Volt1,1,mV5000,1,True ,200,500,1.0,0) 'Return voltage on DiffChan1 Ans = COSH( Volt1 ) NextScan EndProg Spatial Covariance The CovSpa instruction computes the covariance(s) of sets of data that are loaded into arrays.
Section 8. Processing and Math Instructions Exp Returns e (the base of natural logarithms) raised to a power. Syntax x = Exp (source) Remarks If the value of the source exceeds 709.782712893, an Overflow error occurs. The constant e is approximately 2.718282. NOTE The Exp function complements the action of the Log function and is sometimes referred to as the antilogarithm. Exp FunctionExample The example uses Exp to calculate the value of e. Exp(1) is e raised to the power of 1.
Section 8. Processing and Math Instructions Parameter & Data Type Units Constant Options Constant Enter The units for Tau. Alpha Numeric Code Code Units USEC 0 microseconds MSEC 1 milliseconds SEC 2 seconds MIN 3 minutes A code to indicate what values to calculate and output. Code Result 0 FFT. The output is N/2 complex data points, i.e., the real and imaginary parts of the FFT. The first pair is the DC component and the Niquist component.
Section 8. Processing and Math Instructions Notes: • Power is independent of the sampling rate (1/tau) and of the number of samples (N). • The PSD is proportional to the length of the sampling period (T=N*tau), since the “ width” of each bin is 1/T. • The sum of the AC bins (excluding DC) of the Power Spectrum is the Variance (AC Power) of the time series.
Section 8. Processing and Math Instructions Parameter & Data Type Dest Array Enter TableName name RecsBack Const. Or variable The name of the data table to retrieve the record from. The destination variable array in which to store the fields of the record. The array must be dimensioned large enough to hold all the fields in the record. The number of records back from the most recent record stored to go to retrieve the record (1 record back is the most recent).
Section 8. Processing and Math Instructions Parameter & Data Type TintoInt constant Interval constant Units Constant Enter The time into interval sets an offset from the datalogger’s clock to the interval at which the IfTime will be true. For example, if the Interval is set at 60 minutes, and TintoInt is set to 5, IfTime will be True at 5 minutes into the hour, every hour, based on the datalogger's real-time clock. If the TintoInt is set to 0, the IfTime statement is True at the top of the hour.
Section 8.
Section 8. Processing and Math Instructions Dim A, B, C, D BeginProg A = Int(-99.8) B = Fix(-99.8) C = Int(99.8) D = Fix(99.8) EndProg 'Declare variables. 'Returns -100 'Returns -99 'Returns 99 'Returns 99 Log (Source) Returns the natural logarithm of a number. Syntax x = Log (source) Remarks The source can be any valid numeric expression that results in a value greater than 0. The natural logarithm is the logarithm to the base e. The constant e is approximately 2.718282.
Section 8. Processing and Math Instructions LOGN( x ) = LOG10( x ) / LOG10( n ) LOG10 Function Example This example uses the LOG10 instruction to calculate the log base 2 of 1000. Dim LOG2_1000 'Declare variables. LOG2_1000 = LOG10(1000)/ LOG10(2) MemoryTest (Dest) Stores the results of the most recent memory test in a variable. Syntax MemoryTest (Dest) Remarks The CR5000 tests CPU RAM and Task Sequencer memory when it compiles and runs a program.
Section 8. Processing and Math Instructions MaxSpa Function Example This example uses MaxSpa to find the maximum value of the five elements Temp(6) through Temp(10) and store the result in the variable MaxTemp. MaxSpa(MaxTemp, 5, Temp(6)) MinSpa (Dest, Swath, Source) Finds the minimum value in an array. Syntax MinSpa(Dest, Swath, Source) Remarks Find the minimum value in the given array and place the result in the variable named in Dest. The Source must be a particular element in an array (e.g.
Section 8. Processing and Math Instructions Dim TestYr, LeapStatus TestYr = 1995 If TestYr Mod 4 = 0 And TestYr Mod 100 = 0 Then If TestYr Mod 400 = 0 Then LeapStatus = True Else LeapStatus = False End If ElseIf TestYr Mod 4 = 0 Then LeapStatus = True Else LeapStatus = False End If 'Declare variables. 'Divisible by 4? 'Divisible by 400? Move (Dest, Swath, Source) Moves a block or fills an array. Syntax Move(Dest, Reps, Source, Reps) Remarks Block Move or fill array.
Section 8. Processing and Math Instructions Remarks The following table illustrates how Result is determined: If expr is The result is True False False True Null Null The NOT operator also inverts the bit values of any variable and sets the corresponding bit in result according to the following truth table: If bit in expr1 is The result is 0 1 1 0 NOT Operator Example The example sets the value of the variable Msg depending on the state of Flag(1).
Section 8. Processing and Math Instructions If bit in expr1 is 0 0 1 1 And bit in expr2 is 0 1 0 1 The result is 0 1 1 1 Or Operator Example The example sets Msg that depends on the value of variables A, B, and C, assuming that no variable is a Null. If A = 10, B = 8, and C = 11, the left expression is True and the right expression is False.
Section 8. Processing and Math Instructions The following example uses sine and cosine signal inputs to illustrate the use of PeakValley with two repetitions. Data Table PV1 stores the peaks and valleys from the cosine wave. PV2 stores the peaks and valleys from the sine wave. PV3 stores the peaks and valleys from both.
Section 8. Processing and Math Instructions PRT (Dest, Reps, Source, Mult, Offset) Used to calculate temperature from the resistance of an RTD. Syntax PRT (Dest, Reps, Source, Mult, Offset) Remarks This instruction uses the result of a previous RTD bridge measurement to calculate the temperature. The input (Source) must be the ratio Rs/R0, where Rs is the RTD resistance and R0 the resistance of the RTD at 0° C.
Section 8. Processing and Math Instructions RealTime Used to pick out year, month, day, hour, minute, second, usecond, day of week, and/or day of year from the CR5000 clock. Syntax RealTime(Dest) Remarks RealTime Example This example uses RealTime to place all time segments in the Destination array. If the remark (‘) is removed from the first 8 Sample statements and the last Sample statement is remarked, the results will be exactly the same.
Section 8. Processing and Math Instructions RectPolar (Dest, Source) Converts from rectangular to polar coordinates. Parameter & Data Type Dest Variable array Source Variable Array Enter Variable array in which to store the 2 resultant values. The length of the vector is stored in the specified destination element and the angle, in radians(± π), in the next element of the array The variable array containing the X and Y coordinates to convert to Polar coordinates.
Section 8. Processing and Math Instructions RMSSpa (Dest, Swath, Source) Used to compute the RMS value of an array. Syntax RMSSpa(Dest, Swath, Source) Remarks Spatial RMS, Calculate the root mean square of values in an array. i = j + swath Dest = ∑ ( X (i)) 2 i= j swath Where X(j) = Source Parameter & Data Type Dest Variable Swath Constant Source Array Enter The variable in which to store the RMS value. The number of values of the array to include in the RMS calculation.
Section 8. Processing and Math Instructions To have the program generate a different random-number sequence each time it is run, use the Randomize statement with no Number argument to initialize the random-number generator before RND is called. To produce random integers in a given range, use this formula: INT( ( upperbound - lowerbound + 1 ) * RND + lowerbound ) Here, upperbound is the highest number in the range, and lowerbound is the lowest number in the range.
Section 8. Processing and Math Instructions Full bridge strain gage, 2 gages parallel to +ε , the other 2 parallel to −ε: 4 6 µε = −10 Vr GF Full bridge strain gage, half the bridge has 2 gages parallel to +ε and −ε: the other half +νε and −νε: 5 6 µε = Code 6 −2 ⋅ 10 Vr GF(ν + 1) Configuration Full bridge strain gage, one half +ε and +ε .
Section 8. Processing and Math Instructions Sub Zero Count = 0 'Reset Count Scan(10,mSec,0,100) 'Scan 100 times BrFull(ZStrain,1,mV50,5,1,6,7,1,5000,1,0,0,100,1,0) Count = Count + 1 'Increment Counter used By DataTable CallTable ZERO_1 'Zero_1 outputs on last scan (Count=100) Next Scan ZStrain = ZERO_1.
Section 8. Processing and Math Instructions Here, upperbound is the highest number in the range, and lowerbound is the lowest number in the range. Rnd Function Example The example uses the Rnd function to generate random integer values from 1 to 9. Each time this program is run, Randomize generates a new randomnumber sequence. Dim Wild1, Wild2 Randomize Wild1 = Int(9 * Rnd + 1) Wild2 = Int(9 * Rnd + 1) 'Declare variables. 'Seed random number generator. 'Generate first random value.
Section 8. Processing and Math Instructions The Sin function takes an angle and returns the ratio of two sides of a right triangle. The ratio is the length of the side opposite the angle divided by the length of the hypotenuse. The result lies in the range -1 to 1. To convert degrees to radians, multiply degrees by π/180. To convert radians to degrees, multiply radians by 180/π. Returns the sine of the value in parentheses. The input must be in radians.
Section 8. Processing and Math Instructions Sqr Function Example The example uses Sqr to calculate the square root of Volt(1) value. Dim Msg, Number Number = Volt(1) If Number < 0 Then Msg = 0 'Declare variables. 'Get input. ‘Cannot determine the square root of a negative number. Else Msg = Sqr(Number) End If StdDevSpa Used to find the standard deviation of an array. Syntax StdDevSpa(Dest, Swath, Source) Remarks Spatial standard deviation.
Section 8. Processing and Math Instructions Tan Function Example The example uses Tan to calculate the tangent of an angle from a Volt(1) input. Dim Degrees, Pi, Radians, Ans Pi = 4 * Atn(1) Degrees = Volt(1) Radians = Degrees * (Pi / 180) Ans = Tan(Radians) 'Declare variables. 'Calculate Pi. 'Get user input. 'Convert to radians. ‘The Tangent of Degrees. TANH (Source) The TANH function returns the hyperbolic tangent of an expression or value.
Section 8. Processing and Math Instructions The XOR operator also performs a bit-wise comparison of identically positioned bits in two numeric expressions and sets the corresponding bit in result according to the following truth table: If bit in expr1 is And bit in expr2 is The result is 0 0 0 0 1 1 1 0 1 1 1 0 XOR Operator Example The example sets the variable Msg based on the value of variables A, B, and C, assuming that no variable is a Null.
Section 9. Program Control Instructions BeginProg, EndProg The BeginProg instruction is used to mark the beginning of a program. EndProg marks the end of a program. Syntax BeginProg ... ... EndProg Remarks All of the instructions for the main program fall between the BeginProg and EndProg statements. Program Variables, DataTables, and Subroutines must be defined before the main program. The BeginProg/EndProg statements are not necessary if there are no subroutines or DataTables.
Section 9. Program Control Instructions Scan (1,Sec,3,0) RealTime (TIME) PulseCount (WINDSP,1,1 ,1,1,1.0,0) PulseCount (RAIN,1,2,2,0,1.0,0) CallTable METDATA NextScan EndProg Call The Call statement is used to transfer program control from the main program to a subroutine. Syntax Call Name(list of variables) Remarks Use of the Call keyword when calling a subroutine is optional. The Call statement has these parts: Call Call is an optional keyword used to transfer program control to a subroutine.
Section 9. Program Control Instructions DataTable is called, it will process data as programmed and check the output condition. CallTable Example This example uses CallTable to call the ACCEL table. CallTable ACCEL Data, Read, Restore Used to mark the beginning of a data list. Syntax Data list of constants Read [VarExpr] Restore Remarks Data function: A list of floating point constants that can be read (using Read) into an Array Variable. Parameter: A list of floating point constants.
Section 9. Program Control Instructions its own (e.g., a GPS receiver). The input time would periodically or conditionally be converted into the required variable array and ClockSet would be used to set the CR5000 clock. Source Array The source must be a seven element array . array(1)..array(7) should hold respectively year, month, day, hours, minutes, seconds, and microseconds.. Delay (Option, Delay, Units) Used to delay the program.
Section 9. Program Control Instructions Do Repeats a block of statements while a condition is true or until a condition becomes true. Syntax 1 Do [{While | Until} condition] [statementblock] [Exit Do] [statementblock] Loop Syntax 2 Do [statementblock] [Exit Do] [statementblock] Loop [{While | Until} condition] The Do...Loop statement has these parts: Part Description Do Must be the first statement in a Do...Loop control structure. While Indicates that the loop is executed while condition is true.
Section 9. Program Control Instructions Alternatively, the same thing can be accomplished by incorporating the range test in the Do...Loop as follows: Dim Reply 'Declare variable. Do Reply = Volt(1) Loop Until Reply > 1 And Reply < 9 The next example show the use of Wend. While X > Y 'Old fashioned way of looping. ......... ......... Wend Do While X > Y ......... ......... Loop 'Much better FileManage The FileManage instruction is used to manage files from within a running datalogger program.
Section 9. Program Control Instructions FileManage Example The statement below uses FileManage to run TEMPS.CR5, which is stored on the datalogger's CPU, when Flag(2) becomes high. If Flag(2) then FileManage( "CPU:TEMPS.CR5" 4 ) '4 means Run Now FileMark (TableName) Parameter & Data Type TableName name Enter The name of the data table in which to insert the filemark.. FileMark is used to insert a filemark into a data file.
Section 9. Program Control Instructions Exit For Only used within a For...Next control structure to provide an alternate way to exit. Any number of Exit For statements may be placed anywhere in the For...Next loop. Often used with the evaluation of some condition (for example, If...Then), Exit For transfers control to the statement immediately following the Next. Next Ends a For...Next loop. Causes increment to be added to counter.
Section 9. Program Control Instructions If ... Then ... Else Statement Allows conditional execution, based on the evaluation of an expression. Syntax 1 If condition Then thenpart [Else elsepart] Syntax 2 If condition1 Then [statementblock-1] [ElseIf condition2 Then [statementblock-2] ] [Else [statementblock-n] ] End If Syntax 1 Description The single-line form is often useful for short, simple conditional tests. Syntax 1 has these parts: Part Description If Begins the simple If...Then control structure.
Section 9. Program Control Instructions Part Description If Keyword that begins the block If...Then decision control structure. condition1 Same as condition used in the single-line form shown above. Then Keyword used to identify the actions to be taken if a condition is satisfied. statementblock-1 One or more CRBasic statements executed if condition1 is true. ElseIf Keyword indicating that alternative conditions must be evaluated if condition1 is not satisfied.
Section 9. Program Control Instructions If...Then ... Else Statement Example The example illustrates the various forms of the If...Then...Else syntax. Dim X, Y, Temp( 5 ) X = Temp( 1 ) If X < 10 Then Y=1 ElseIf X < 100 Then Y=2 Else Y=3 End If .... .... 'Declare variables. '1 digit. '2 digits. '3 digits. 'Run some code 'Run some code Power Off Used to turn the CR5000 off until a designated time.
Section 9. Program Control Instructions Power off can also be used in conjunction with the power-up digital inputs to set up the CR5000 to power up in response to external trigger, make a series of measurements, and then power off. If the "<0.5 " input is switched to ground or if the ">2" input has a voltage greater than 2 volts applied, the CR5000 will awake, load the program in memory and run. If the "< 0.
Section 9. Program Control Instructions instruction. The Attribute codes are actually a bit field. The codes are as follows: Bit Decimal Description bit 1 2 Run on power up bit 2 4 Run now RunDLDFile Example The statement below uses RunDLDFile to run TEMPS.DLD, which is stored on the datalogger's CPU, when Flag(2) becomes high. If Flag(2) then RunDLDFile( "CPU:TEMPS.DLD" 4 ) '4 means Run Now Reset Table Used to reset a data table under program control.
Section 9. Program Control Instructions Parameter & Data Type Interval Constant Units Constant Option Constant Enter Enter the time interval at which the scan is to be executed. The interval may be in µs, ms, s, or minutes, whichever is selected with the Units parameter. The maximum scan interval is one minute. The units for the time parameters.
Section 9. Program Control Instructions Select Case Statement Executes one of several statement blocks depending on the value of an expression. Syntax Select Case testexpression [Case expressionlist1 [statementblock-1] ] [Case expressionlist2 [statementblock-2] ] [Case Else [statementblock-n] ] End Select The Select Case syntax has these parts: Part Description Select Case Begins the Select Case decision control structure. Must appear before any other part of the Select Case structure.
Section 9. Program Control Instructions The argument expressionlist has these parts: Part Description expression Any numeric expression. To Keyword used to specify a range of values. If you use the To keyword to indicate a range of values, the smaller value must precede To. Although not required, it is a good idea to have a Case Else statement in your Select Case block to handle unforeseen testexpression values. You can use multiple expressions or ranges in each Case clause.
Section 9. Program Control Instructions Sleep The Sleep instruction is used to put the datalogger in a quiescent mode between program scans. Syntax Sleep Remarks This instruction allows the datalogger to go into its lowest current state between program scans. The Sleep instruction affects only the scan in which it resides. Sleep Program Example The following program has two separate scans. One scan uses the Sleep instruction to put the datalogger in low power mode between scans.
Section 9. Program Control Instructions the minimum time for the SlowSequence scan interval is the product of the number of SlowSequence measurement segments and the primary scan interval. One function of a SlowSequence is to update the calibration table. The measurements in a single "scan" of the SlowSequence may be spread out over a longer time period because the measurements can be parceled into multiple primary scans.
Section 9. Program Control Instructions SubScan (SubInterval, Units, SubRatio) The SubScan instruction is used to control an AM16/32 multiplexer or to measure some analog inputs at a faster rate than the program scan. Syntax SubScan (SubInterval, Units, SubRatio) Measurements and processing Next SubScan Remarks The SubScan/NextSubScan instructions are placed within the Scan/NextScan instructions of a program.
Section 9. Program Control Instructions 'The Thermocouples are connected to differential channels 1-6.
Section 9. Program Control Instructions Parameter & Data Type TimNo Constant, Variable, or Expression Units Constant TimOpt Constant Enter An integer number for the timer (e.g., 0, 1, 2, . . .) Use low numbers to conserve memory; using TimNo 100 will allocate space for 100 timers even if it is the only timer in the program. The units in which to return the timer value. Alpha Numeric Code Code Units USEC 0 microseconds MSEC 1 milliseconds SEC 2 seconds MIN 3 minutes The action on the timer.
Section 9. Program Control Instructions NOTE StatementBlock The StatementBlock is the portion of the program that should be repeated until the loop is terminated. These instructions lie between the While and Wend statements. Wend The Wend statement ends the While...Wend control structure. The Do...Loop statement provides more structure and a more flexible way to perform looping. While...Wend Statement Example This example creates a While...Wend that is exited only if Reply is within a range.
Appendix A. CR5000 Status Table The CR5000 status table contains current system operating status information that can be accessed from the running CR5000 program or monitored by PC software. There is also a way to view the status information from the keyboard. Table 1 shows the variables in the status table and a brief explanation of each follows. Table 1.
Appendix A. CR5000 Status Table CalSeOffset CalDiffOffset CardStatus CompileResults Integer(array) Integer(array) string string ROMVersion - Version of the ROM code. This value is stored in the ROM and read by the OS at compile time. OSVersion - Current version of the operating system. OSItem - The CSI item number for the operating system. OSDate - Date that the Operating System was compiled. StationName - String stored as the Station Name of the CR5000.
Appendix A. CR5000 Status Table DLDBytesFree - Amount of free space in the CPU RAM disk that is used to store program files. ProcessTime - Time in microseconds that it took to run through processing on the last scan. Time is measured from the end of the EndScan instruction (after the measurement event is set) to the beginning of the EndScan (before the wait for the measurement event begins) for the subsequent scan. MaxProcTime - The maximum time required to run through processing for the current scan.
Appendix A. CR5000 Status Table CommActive - A variable signaling whether or not communications is currently active (increments each time the autobaud detect code is executed). ProgErrors - The number of compile (or runtime) errors for the current program. ErrorCalib - A counter that is incremented each time a bad calibration value is measured. The value is discarded (not included in the filter update) and this var is incremented. VarOutOfBound - Flags whether an array was accessed out of bounds.
Index A D ABS 8-1 ACOS 6-13, 8-2 Alias 4-2, 4-4, 4-9, 5-1, 6-14, 8-23, 8-24, 9-1 AM25T OV2, 1-10, 7-29 AND 7-28, 8-2 ASIN 8-3 ATN 8-4, 8-7, 8-21, 8-24, 8-30, 8-32, 8-33 ATN2 8-4, 8-5 Average 4-6, 6-11 AvgRun 8-6, 8-7 AvgSpa 8-5, 8-6 Data, Read, Restore 9-3 DataEvent 4-11, 6-1, 6-4, 6-5, 6-6, 6-7 DataInterval 4-4, 4-5, 6-1, 6-2, 6-3, 6-4, 6-5, 6-7, 6-18, 7-22, 7-26, 8-23, 8-27, 9-1, 9-18 DataTable EndTable OV-8, 2-1, 3-7, 4-4, 4-5, 4-9, 6-1, 6-2, 6-4, 6-5, 6-7, 6-8, 6-14, 6-15, 6-18, 7-22, 7-26, 8-21, 8-2
Index I If ... Then ...
Index TimerIO OV-2, 7-27 Totalize 6-27, 9-1 U Units 2-10, 2-11, 4-4, 4-5, 4-6, 5-3, 6-2, 6-3, 6-4, 6-5, 6-7, 6-12, 6-13, 7-5, 7-15, 7-22, 7-26, 7-27, 7-28, 7-30, 7-36, 7-42, 9-4, 9-11, 9-13, 9-14, 9-19 V VoltDiff OV-2, 7-3, 8-7, 8-8, 8-30, 8-32, 9-17 VoltSE OV-2, 4-10, 7-3, 9-17 W While…Wend 9-6, 9-21, 9-22 WorstCase 4-11, 6-1, 6-6, 6-7 WriteIO OV-2, 1-11, 7-28 Index-3
Index This is a blank page.
This is a blank page.
Campbell Scientific Companies Campbell Scientific, Inc. (CSI) 815 West 1800 North Logan, Utah 84321 UNITED STATES www.campbellsci.com info@campbellsci.com Campbell Scientific Africa Pty. Ltd. (CSAf) PO Box 2450 Somerset West 7129 SOUTH AFRICA www.csafrica.co.za cleroux@csafrica.co.za Campbell Scientific Australia Pty. Ltd. (CSA) PO Box 444 Thuringowa Central QLD 4812 AUSTRALIA www.campbellsci.com.au info@campbellsci.com.au Campbell Scientific do Brazil Ltda.