
Manual

CANNON
®
miniAV-X Automatic Viscometer with VISCPRO
®
Instruction & Operation Manual
Version 1.Ob— March, 2012; CANNON
®
Instrument Company
2139 High Tech Road • State College, PA 16803 • USA
94
{1,10} Efflux%—For multi-drop samples: displays the first 10
sample efflux times
{1,20} Efflux%—For multi-drop samples: displays the first 20
sample efflux times
Avg Efflux%—The average efflux time for efflux values used for
viscosity calculation
C, E—The calibration constants used for this determination
SUS—Saybolt Furol Seconds calculation
% KE—Percent contribution of the kinetic energy correction to the
measured viscosity.
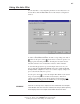
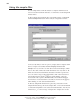
Reporting options
The CAV Data Table analysis can present all or any of the above data
for samples residing in the database. Several powerful filters may be used
to create useful reports. These filters may be used by making selections
from the tabbed property sheets found in the Sample Analysis Configu-
ration window. Once the appropriate filters have been designated, the
resulting report configuration can be saved for future use.
Configuring the CAV Data Table
For general information on using analyses, see Chapter 6. To access and
configure the CAV Data Table, follow the procedure below:
1. Select Analyses from the VISCPRO
®
primary menu options.
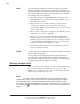
2. Select View Analysis ... from the Analyses menu. The Choose
Analysis window will appear.
3. Double-click Basic Package from the list of Available Analysis
Packages.
4. Select CAV Data Table from the Basic Package report options.