
Manual


89
CANNON
®
miniAV-X Automatic Viscometer with VISCPRO
®
Instruction & Operation Manual
Version 1.0b— March, 2012; CANNON
®
Instrument Company
2139 High Tech Road • State College, PA 16803 • USA
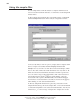
include data from all samples starting with S. %S% would include data
from all samples containing S. The underscore (_) is a single-character
wildcard.
You may use multiple IDs separated by a comma. For example,
AV%,40C% would display all samples beginning with AV or 40C.
NOTE
If no instruments/tubes/Sample IDs are selected, the analysis will display
data for ALL instruments/tubes/Sample IDs.
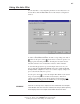
Using the report/port output filter
Use the Report or Port Output filter to determine which data will be
calculated and/or included in the analysis, and/or in what sequence that
data will be displayed. Report/Port Output filter options will vary
depending on the nature of the analysis. For more information on Re-
port/Port Output filter options, please see the chapter on the specific
analysis.
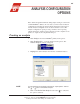
Reconfiguring a displayed analysis
An on-screen analysis may be reconfigured using the same filtering tools
available when creating a new configuration. To access configuration
options for a displayed analysis:
1. Select Analyses from the VISCPRO
®
primary menu options.
2. Select Configure Analysis from the Analyses options.
3. Select the desired analysis from the available analyses. The Sample
Analysis Configuration window will appear.
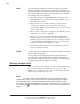
4. Reconfigure the analysis as desired by clicking the tabs to access the
Date, Sample and Report filtering options (see previous sections).
When done, click OK.
5. You will be prompted to save the new analysis configuration. After
you make your selection(s), the analysis will be performed and
displayed using the new configuration settings.
Resizing table columns
To resize columns from a displayed analysis for easier viewing/printing,
move your mouse pointer/cursor to the edge of the desired column
heading. The mouse pointer will change to a bi-dimensional arrow.
Click and drag the edge of the heading to the new location and then
release the mouse button. The entire column will be resized as you drag.
User column size settings will be maintained as long as the analysis
window is open.