
User's Manual
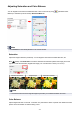
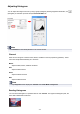


Adjusting Histogram
You can adjust the image color tone by using a graph (histogram) showing brightness distribution, via
(Histogram) in ScanGear (scanner driver)'s Advanced Mode tab.
Note
• Click Defaults to reset all adjustments in the current window.
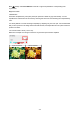
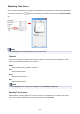
Channel
Each dot of an image is a mixture of Red, Green, and Blue in various proportions (gradation). These
colors can be adjusted individually as a "channel."
Master
Adjust the Red, Green, and Blue combined.
Red
Adjust the Red channel.
Green
Adjust the Green channel.
Blue
Adjust the Blue channel.
Note
• Only Grayscale will be displayed in Channel when Color Mode is Grayscale.
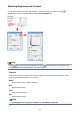
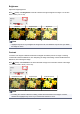
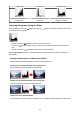
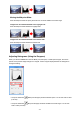
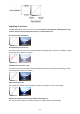
Reading Histograms
You can see the histogram of a specified area for each Channel. The higher the histogram peak, the
more data is distributed to that level.
505