
User`s guide

EE Pro for TI - 89, 92 Plus
Analysis - Introduction to Analysis
8
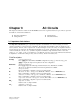
Input entered symbolically Calculated Output also symbolic
Example 2.3 (Graphical Results)
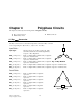
Construct a Bode diagram for a system with pole locations at 1000, 10000, 50000, a zero at 5000, and a
proportionality constant of 1000000.
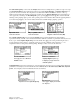
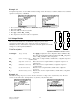
1. From the home screen of EE•Pro, press the „ key to display the pull down menu listing all the sections
available under Analysis.
2. Press z to access the Gain and Frequency section to view a pop up menu of available topics.
3. Press ¨ to open the input screen for Transfer Functions.
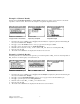
4. Choose Roots for Inputs, enter 1000000 for Constant, {5000} for Zeroes List and {1000, 10000, 50000} for
Poles List.
5. Press the Solve key „.
6. The results of the calculations are displayed in the data screen as shown.
7. Press N key to revert to the pop up display for Gain and Frequency, and press © to access Bode Diagram
input screen.
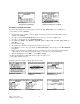
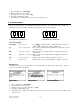
8. Begin entering parameters for graphing the Gain of the Transfer Function. The minimum and maximum
values for the horizontal axis show the default settings. Note that log (ω) is the horizontal axis.
9. Move the highlight bar to set ω-Min to 1, and ω-Max to 200000.
10. Move the highlight bar to Auto Scale and press ˆ to select this option.
11. Press …to graph the function.
Examples of the screen display for this problem are shown here:
Pull down menu of Pop up menu for Gain and Input Screen for Analysis
Frequency Function Transfer
Graphing parameters Split Screen Graph Partial view of Transfer function