
User's Manual


Recorder Status – cs5recstatus (AI-04)
Page 2 of 3
Page 2 of 3 December 10
th
, 2015
B. Main-Section
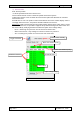
In addition to the master-LED in normal mode the main-section (Figure 3) is displayed.
While the sound status shows whether audio recording is activated, the head correction- and channel-
status each show the current status on the left side and the worst occurring status on the right side of
the corresponding symbol.
If head correction has not been initialized, the head correction symbol shows a grey head.
So if an error occurred since the last reset (i.e. start of a new sweep) the corresponding symbol will
show red on the right side even if the current status is green.
When hovering with the mouse on the main-section the detail-section unfolds.
Figure 3: Main-section with sound-, head correction-
and channel-status
C. Detail-Section
The detail-section (Figure 4) is displayed when the program is in maximized mode or when the mouse
hovers over the main-section of the program.
Beside the current and worst measured taxonomic distance (and standard deviation) it displays the
RMS-values and positional status for each channel/sensor.
Inactive channels are greyed and reference sensors are colored green if activated or red if turned off.
Please note: The displayed values always show the mean or standard deviation of the real-time-
positional data over the last 4 seconds of the measurement since the last reset. So during the first 4
seconds after a reset fewer samples are analyzed. Also keep in mind that the real-time-data is limited
to 62.5 Hz sampling frequency so real-time- and recorded data are not identical.
a) Taxonomic Distance-values
Taxonomic distance values (Figure 4 from left to right):
1. Mean value (mm) over the last 4 seconds of the measurement.
2. Worst occurring mean value (mm) since the last reset of the status.
3. Standard deviation (mm) over the last 4 seconds of the measurement.
4. Worst occurring standard deviation (mm) since the last reset of the status.
b) RMS-values
RMS: Mean value over the last 4 seconds of the measurement.
-max: Worst occurring mean value since the last reset of the status.
c) Value limits
The taxonomic distance limits and the RMS-limit can be set in the settings-dialog.
For the taxonomic distance limits you can either use the limits used by cs5normpos or set your
own custom limits for the real-time-status (recommended since the maximum distance of the real-
time-data is usually higher than the mean over the whole sweep).
The status color will change from green to yellow when the observed value exceeds 2/3 of the set
limit and will turn red if it exceeds the limit.
Example for RMS-limit 60:
RMS 0-40
green RMS 40-60
yellow RMS over 60
red
Sound status
Head correction status
Channel status