
Owner's Manual


USING THE EQ2015 & EQ2030
Comments on using 2/3 & 1/3 octave equalizers to establish a flat frequency
response.
A 1/3 or 2/3 octave Equalizer provides the capability to make very fine correc-
tions to the frequency response of an audio r system. There is no question about
that. However, many users of such equalizers have only a vague idea of how to
actually achieve an accurate frequency response using a 1/3 or 2/3 octave equal-
izer. A loudspeaker’s worst problems can be corrected “by ear” to an extent depend-
ing on the skill of the individual. But in order to achieve the precise correction
the EQ is capable of providing, it is necessary to see the actual frequency
response of the system. This requires a spectrum analyzer.
An Audio Spectrum Analyzer is an electronic device which provides the user with
a frequency response display of the signal provided to the input of the analyzer.
In the case we are discussing, the input to the analyzer would be taken from a
microphone placed in the room with the loudspeakers we wish to equalize. The
sound energy in the room would then be displayed on the analyzer as a graph of
amplitude (loudness) on the vertical axis versus frequency (pitch) on the hori-
zontal axis. If a “1/3 octave” spectrum analyzer is used then there will be a dis-
play of about 30 columns with the height of each column indicating the loudness
of the sound in that frequency band. The 30 columns cover the 10 octave audio
frequency spectrum in 1/3 octave steps. Assuming that both the equalizer and
the analyzer have their frequency bands centered on the standard (ISO) 1/3 octave
frequency centers, then for each slider on the EQ there is a corresponding column
in the analyzers display. If music is played through the system, then the analyzer
displayed will dance about to indicate the sound energy in the room as it varies
in frequency and loudness. The analyzer would not be expected to display a flat
response curve under these conditions because music generally does not have
equal energy in each frequency band but rather has energy at changing frequen-
cies and with changing loudness. This brings up a question: If music played through
the systemcannot be expected to produce a flat frequency response on the spec-
trum analyzer, then is there a signal that will? And the answer is yes; there is a
special test signal that when played through an accurate system and picked up
by an accurate microphone will result in a flat frequency response (each column
at the same height) on the spectrum analyzer display. This test signal is called
“pink noise”.
Pink noise is simply a signal that contains all the audio frequencies at once with
the frequencies in each octave band having the same energy (loudness) as the
frequencies in each of the other bands. If the pink noise is fed directly into the
spectrum analyzer then a perfectly flat display will result. If the pink noise is fed
to the systemand the sound energy from the speakers picked up by the micro-
phone and fed to the analyzer, then the combined response of the loudspeakers
and room (and microphone) will be seen on the analyzer display. Now the appro-
priate sliders on the equalizer can be adjusted to provide a precisely flat frequency
response. Because the microphone is included in the system response curve, it
is important that the microphone have a flat frequency response itself. Otherwise
you’ll be equalizing your loudspeakers for the microphone response also. This
would result in inaccurate response from the loudspeakers themselves.
The description of the equalization procedure may sound complex but the actual
procedure can be performed with surprising ease. That’s because the spectrum
analyzer is doing all the work! It is simple to plug the output of the pink noise
generator into an appropriate input of your audio system and play the pink noise
over the loudspeakers at a level well above the background noise. An accurate
microphone is placed near the usual listening position and the output of the speak-
ers is displayed on the analyzer. From the display it can be seen which frequency
bands need to be boosted or cut to achieve the same level in each band (flat
response). Tweak the equalizer and note the display. Continue to adjust the equal-
izer until a satisfactorily accurate response is obtained. Because the response will
vary with microphone location, it is a good idea to look at the response for sev-
eral microphone locations around the listening position and equalize for the flat-
test average response.
One of the shortcomings of the pink noise equalization technique is the fact that
the analyzer displays both the direct sound from the loudspeaker and the rever-
berant sound field set up in the room. Ideally we want to obtain a flat frequency
response for the direct sound from the loudspeakers. The reverberant sound field
cannot be expected to have a flat response and typically has a decreasing high
frequency response. This means that if the net pink noise response has a flat high
frequency response then the direct sound from the loudspeaker will tend to have
a rising high frequency response (to compensate for the reverberant sound field).
The net result is an overly bright sounding high frequency characteristic for loud-
speaker systems which have been equalized to provide a flat pink noise response.
The approach used to compensate for this is to tailor the pink noise response to
start falling gently above about 2 kHz at a rate of 1 or 2 dB per octave.
There is another equalization method which avoids the high frequency errors
encountered in the pink noise technique and this is the “impulse response” tech-
nique. In recent years impulse testing and equalization have become increasingly
more popular with loudspeaker manufacturers due to the high accuracy and repeata-
bility of this technique. As impulse analyzers become more readily available we
hope to see them used more for 1/3 & 2/3 octave equalization of loudspeakers
in the field. Until then don’t be afraid to trust your ears.
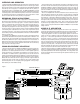
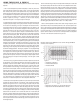
Frequency response of the EQ2030 for various control settings (the EQ2015
will have a similar response).
Figure 2:
—All bands at full boost/cut
—Individual bands boost/cut
—All bands centered
Figure 3:
—Response of one band for 3, 6, and 15 dB of boost/cut
—Response with the 20Hz and 20kHz filters in and out