
User Guide

0
30
60
90
120
150
180
210
240
270
300
330
C
95
90
85
80
75
70
65
60
60
65
70
75
80
85
90
95
0
30
60
90
120
150
180
210
240
270
300
330
C
85
80
75
70
65
60
55
50
50
55
60
65
70
75
80
85
0
30
60
90
120
150
180
210
240
270
300
330
C
95
90
85
80
75
70
65
60
60
65
70
75
80
85
90
95
250 Hz
1k Hz 10k Hz
TCS215
0
30
60
90
120
150
180
210
240
270
300
330
C
90
85
80
75
70
65
60
55
55
60
65
70
75
80
85
90
0
30
60
90
120
150
180
210
240
270
300
330
C
90
85
80
75
70
65
60
55
55
60
65
70
75
80
85
90
0
30
60
90
120
150
180
210
240
270
300
330
C
80
75
70
65
60
55
50
45
45
50
55
60
65
70
75
80
TCS210
0
30
60
90
120
150
180
210
240
270
300
330
C
90
85
80
75
70
65
60
55
55
60
65
70
75
80
85
90
0
30
60
90
120
150
180
210
240
270
300
330
C
90
85
80
75
70
65
60
55
55
60
65
70
75
80
85
90
0
30
60
90
120
150
180
210
240
270
300
330
C
90
85
80
75
70
65
60
55
55
60
65
70
75
80
85
90
TCS115
0
30
60
90
120
150
180
210
240
270
300
330
C
90
85
80
75
70
65
60
55
55
60
65
70
75
80
85
90
0
30
60
90
120
150
180
210
240
270
300
330
C
90
85
80
75
70
65
60
55
55
60
65
70
75
80
85
90
0
30
60
90
120
150
180
210
240
270
300
330
C
80
75
70
65
60
55
50
45
45
50
55
60
65
70
75
80
TCS115M
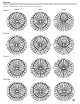
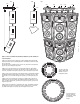
POLAR PLOTS
Polar plots are loudspeaker SPL measurements taken at various rotational positions around the loudspeaker to complete a 360° circle. The purpose of this type of measurement is
to analyze the coverage angles of the loudspeaker at different frequencies and to display the frequency respone attenuation from a given listening position. This will help the user to
set up arrays to achieve the optimum coverage for a given situation. 0° = front of loudspeaker