
Programming Guide

20050401
5-1-3
Sample Graphs
kk
kk
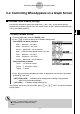
k How to draw a simple graph (2)
Description
You can store up to 20 functions in memory and then select the one you want for graphing.
Set Up
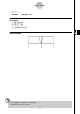
1. From the Main Menu, enter the GRAPH mode.
Execution
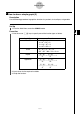
2. Specify the function type and input the function whose graph you want to draw.
You can use the GRAPH mode to draw a graph for the following types of expressions:
rectangular coordinate expression, polar coordinate expression, parametric function,
X = constant expression, inequality.
3(TYPE) 1(Y=) ... rectangular coordinates
2(r=) ... polar coordinates
3(Parm) ... parametric function
4(X=c) ... X = constant function
5(CONV)1('Y=)~5('Y≤) ... changes the function type
6(g)1(Y>)~4(Y≤) ... inequality
Repeat this step as many times as required to input all of the functions you want.
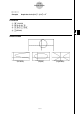
Next you should specify which of the functions among those that are stored in memory
you want to graph (see 5-3-6). If you do not select specific functions here, the graph
operation will draw graphs of all the functions currently stored in memory.
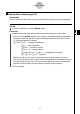
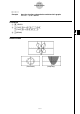
3. Draw the graph.