
Programming Guide


20050401
5-8 Dynamic Graphing
kk
kk
k Using Dynamic Graph
Description
Dynamic Graph lets you define a range of values for the coefficients in a function, and then
observe how a graph is affected by changes in the value of a coefficient. It helps to see how
the coefficients and terms that make up a function influence the shape and position of a
graph.
Set Up
1. From the Main Menu, enter the DYNA mode.
2. Make V-Window settings.
Execution
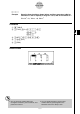
3. On the Setup screen, specify the Dynamic Type.
1(Cnt) ... Continuous
2(Stop) ... Automatic stop after 10 draws
4. Use the cursor keys to select the function type on the built-in function type list.*
1
5. Input values for coefficients, and specify which coefficient will be the dynamic
variable.*
2
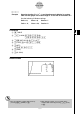
6. Specify the start value, end value, and increment.
7. Specify the drawing speed.
3(SPEED)1( ) ..... Pause after each draw (Stop&Go)
2( ) ....... Half normal speed (Slow)
3( ) ....... Normal speed (Normal)
4( ) ...... Twice normal speed (Fast)
8. Draw the Dynamic Graph.
5-8-1
Dynamic Graphing
*
1
The following are the seven built-in function
types.
•Y=AX+B
•Y=A(X–B)
2
+C
•Y=AX
2
+BX+C
•Y=AX^3+BX
2
+CX+D
•Y=Asin(BX+C)
•Y=Acos(BX+C)
•Y=Atan(BX+C)
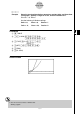
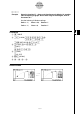
After you press 3(TYPE) and select the
function type you want, you can then input the
actual function.
1(Y=) ... rectangular coordinate expression
2(r=) ... polar coordinate expression
3(Parm) ... parametric function
Entering the DYNA mode when a Function Type
that is not one of the three types listed above is
selected in the GRAPH mode causes the
Function Type to change automatically to
“rectangular coordinate expression (Y=)”.
*
2
You could also press w here and display the
parameter setting menu.
# The message “Too Many Functions” appears
when more than one function is selected for
Dynamic Graphing.