
Programming Guide


20050401
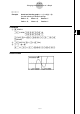
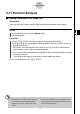
Example Read coordinates and derivatives along the graph of the function
shown below.
Y1 = x
2
– 3
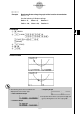
Use the following V-Window settings.
Xmin = –5, Xmax = 5, Xscale = 1
Ymin = –10, Ymax = 10, Yscale = 2
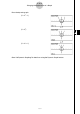
Procedure
1 m
GRAPH
2 !m(SET UP)cccc1(On)J
3 !3(V-WIN) -fwfwbwc
-bawbawcwJ
3(TYPE)1(Y=)vx-dw
6(DRAW)
4 !1(TRCE)
5 d~d
6 -bw
Result Screen
5-11-4
Function Analysis
20050601