
User manual - Chapter 5 Graphing


19990401
5-6-4
Manual Graphing
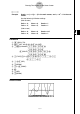
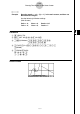
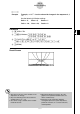
Example Graph the integration
∫
(x + 2)(x – 1)(x – 3) dx.
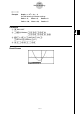
Use the following V-Window settings.
Xmin = –4, Xmax = 4, Xscale = 1
Ymin = –8, Ymax = 12, Yscale = 5
Procedure
1 m
RUN
•
MAT
2 !K(V-Window) -ewewbwc
-iwbcwfwi
3 K6(g)6(g)2(SKTCH)b(Cls)w
2(SKTCH)e(GRAPH)c(∫ dx)
4(v+c)(v-b)(v-d),
-c,bw
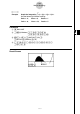
Result Screen
1
–2
20011101