
ClassPad 330 Plus Manual

20060301
5-3-1
Drawing a 3D Graph
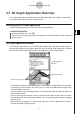
5-3 Drawing a 3D Graph
This section explains how to draw a 3D graph, as well as how to change the angle of a graph
and how to rotate a graph.
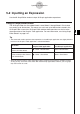
Configuring 3D Graph View Window Parameters
Use the 3D Graph View Window to specify maximum and minimum values for the
x
-axis,
y
-axis,
z
-axis,
s
-variable, and
t
-variable. You can also specify the number of lines you would
like for drawing the grid.
• For the xgrid enter the number of lines you would like drawn within the interval from xmin
to xmax. For example, if xmin =
−
3, xmax = 3 and xgrid= 15, 15 almost vertical lines will be
used to display your graph. The ygrid lines will be almost horizontal.
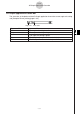
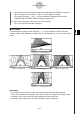
• After drawing a 3D graph, pressing the
=
key cycles the 3D Graph [Axes] setting (page
1-9-8) in the following sequence: “Off”
→
“On”
→
“Box”
→
“Off”, and so on.
Before drawing a graph, be sure to first configure View Window parameters as required to
ensure proper display of the graph.
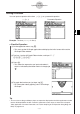
u
ClassPad Operation
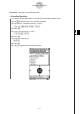
(1) On the application menu, tap
D
.
• This starts up the 3D Graph application and displays the initial screen of the active 3D
Graph Editor window.
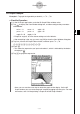
(2) Tap
7
to display the View Window dialog box.
(3) Tap the “3D” option button so the option is selected.
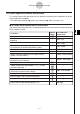
(4) Configure the View Window parameters as described below.
• Press
c
to move the cursor and input an appropriate value for each parameter.
Use this
item:
Initial
default
To configure this View Window parameter:
xmin
xmax
xgrid
ymin
ymax
ygrid
zmin
Minimum
x-axis value
Maximum
x-axis value
Number of grid lines used for
x-axis direction
Minimum
y-axis value
Maximum
y-axis value
Number of grid lines used for
y-axis direction
Minimum
z-axis value
zmax Maximum
z-axis value
angle Clockwise angle of x-axis
angle
Eye position relative to the plane created by
the
x-axis and y-axis, and the angle of the z-axis
φ
θ
–3
3
25
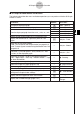
smin
smax
tmin
Minimum
s-variable value
Maximum
s-variable value
Minimum
t-variable value
–3.1415926535
3.14159265358
–3.1415926535
tmax Maximum
t-variable value
3.14159265358
–3
3
25
–3
3
20
70