CFX-9970G GUIDELINES LAID DOWN BY FCC RULES FOR USE OF THE UNIT IN THE U.S.A. (not applicable to other areas). NOTICE This equipment has been tested and found to comply with the limits for a Class B digital device, pursuant to Part 15 of the FCC Rules. These limits are designed to provide reasonable protection against harmful interference in a residential installation.
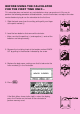
BEFORE USING THE CALCULATOR FOR THE FIRST TIME ONLY... This calculator does not contain any main batteries when you purchase it. Be sure to perform the following procedure to load batteries, reset the calculator, and adjust the color contrast before trying to use the calculator for the first time. 1 1. Slide the back cover from the unit by pulling with your finger at the point marked 1. P MAI 2. Load the four batteries that come with calculator.
f, c, d, e) to select the SYS icon and press w or simply press t . 6. Use the cursor keys ( F c, f) to highlight Color Contrast and then press wto display 7. Use the cursor keys ( the contrast adjustment screen. 8. Adjust the display color. uTo adjust the color contrast 1. Use f and c to move the pointer to CONTRAST. 2. Press e to make the figures on the display darker, and d to make them lighter. uTo adjust the tint 1.
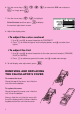
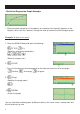
ABOUT THE COLOR DISPLAY The display uses three colors: orange, blue, and green, to make data easier to understand.
• Statistical Regression Graph Example • When you draw a graph or run a program, any comment text normally appears on the display in blue. You can, however, change the color of comment text to orange or green. Example: To draw a sine curve 1. Enter the GRAPH Mode and input the following. 3(TYPE)1(Y=) (Specifies rectangular coordinates.) svwf 45 (Stores the expression.) 2.
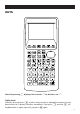
KEYS Note that pressing / displays the character "/" for division, not "÷". Alpha Lock Normally, once you press a and then a key to input an alphabetic character, the keyboard reverts to its primary functions immediately. If you press ! and then a, the keyboard locks in alpha input until you press a again.
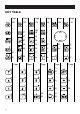
KEY TABLE Page Page Page Page Page Page 128 132 113 154 144 120 27 383 28 4 3 47 46 47 46 46 46 45 45 45 46 46 45 45 45 47 47 36 36 2 2 49 49 Page 49 Page Page 22 Page Page 21 20 45 36 vi 36 36 36 36 39 36
Quick-Start Turning Power On And Off Auto Power Off Function Using Modes Basic Calculations Replay Features Fraction Calculations Exponents Graph Functions Dual Graph Box Zoom Dynamic Graph Table Function
Quick-Start Welcome to the world of color graphing calculators and the CASIO “CFX-9970G”. Quick-Start is not a complete tutorial, but it takes you through many of the most common functions, from turning the power on, to specifying colors, and on to graphing complex equations. When you’re done, you’ll have mastered the basic operation of the “CFX9970G” and will be ready to proceed with the rest of this user’s guide to learn the entire spectrum of functions available.
Quick-Start defc to highlight RUN and then press w. 2. Use This is the initial screen of the RUN mode, where you can perform manual calculations, and run programs. BASIC CALCULATIONS With manual calculations, you input formulas from left to right, just as they are written on paper. With formulas that include mixed arithmetic operators and parentheses, the calculator automatically applies true algebraic logic to calculate the result. Example: 15 × 3 + 61 1. Press o to clear the calculator. 2.
Quick-Start o. 1. Press SET UP !m to switch the set up display. 2. Press cccc1 (Deg) to specify 3. Press degrees as the angle unit. 4. Press J to clear the menu. 5. Press o to clear the unit. 6. Press cf*sefw. REPLAY FEATURES d e With the replay feature, simply press or to recall the last calculation that was performed. This recalls the calculation so you can make changes or re-execute it as it is.
Quick-Start FRACTION CALCULATIONS $ You can use the key to input fractions into calculations. The symbol “ { ” is used to separate the various parts of a fraction. Example: 1 15/16 + 37/9 1. Press o. 2. Press b$bf$ bg+dh$ jw. Indicates 6 7/144 Converting a Mixed Fraction to an Improper Fraction d/c While a mixed fraction is shown on the display, press improper fraction. ! $ to convert it to an d/c Press ! $ again to convert back to a mixed fraction.
Quick-Start EXPONENTS Example: 1250 × 2.065 1. Press o. 2. Press bcfa*c.ag. 3. Press M and the ^ indicator appears on the display. f 4. Press . The ^5 on the display indicates that 5 is an exponent. 5. Press w.
Quick-Start GRAPH FUNCTIONS The graphing capabilities of this calculator makes it possible to draw complex graphs using either rectangular coordinates (horizontal axis: x ; vertical axis: y) or polar coordinates (angle: θ ; distance from origin: r). Example 1: To graph Y = X(X + 1)(X – 2) 1. Press m. d, e, f, and c to highlight GRAPH, and then press w. 2. Use 3. Input the formula. v (v+b) (v -c)w 6 4. Press 6 (DRAW) or w to draw the graph. Example 2: To determine the roots of Y = X(X + 1)(X – 2) 1.
Quick-Start 1 (ROOT). Press e for other roots. 2. Press Example 3: Determine the area bounded by the origin and the X = –1 root obtained for Y = X(X + 1)(X – 2) 1. Press !5 (G-Solv). 123456 2. Press 6 (g). 123456 3. Press 4. Use 3 (∫dx). e to move the pointer to the location where w. Next, use e again X = –1, and then press to move the pointer to the location where X = 0, and then press w to input the integration range, which becomes shaded on the display.
Quick-Start DUAL GRAPH With this function you can split the display between two areas and display two graphs on the same screen. Example: To draw the following two graphs and determine the points of intersection Y1 = X(X + 1)(X – 2) Y2 = X + 1.2 !Zcc1 1. Press (Grph) to specify “Graph” for the Dual Screen setting. 1 23456 J, and then input the two functions. v(v+b) (v-c)w v+b.cw 2. Press 6 12345 3. Press 6 (DRAW) or w to draw the graphs.
Quick-Start def c 3. Use , , , and to move the pointer again. As you do, a box appears on the display. Move the pointer so the box encloses the area you want to enlarge. w 4. Press , and the enlarged area appears in the inactive (right side) screen. DYNAMIC GRAPH Dynamic Graph lets you see how the shape of a graph is affected as the value assigned to one of the coefficients of its function changes.
Quick-Start 4 bw to assign an initial value 4. Press (VAR) of 1 to coefficient A. 1 2 23456 bwdwbw 5. Press (RANG) to specify the range and increment of change in coefficient A. 6. Press J. 6 7. Press (DYNA) to start Dynamic Graph drawing. The graphs are drawn 10 times.
Quick-Start TABLE FUNCTION The Table Function makes it possible to generate a table of solutions as different values are assigned to the variables of a function. Example: To create a number table for the following function Y = X (X+1) (X–2) 1. Press m. d, e, f, and c to highlight TABLE, and then press w. 2. Use 3. Input the formula. v(v+b) (v-c)w 6 4. Press table.
Handling Precautions • Your calculator is made up of precision components. Never try to take it apart. • Avoid dropping your calculator and subjecting it to strong impact. • Do not store the calculator or leave it in areas exposed to high temperatures or humidity, or large amounts of dust. When exposed to low temperatures, the calculator may require more time to display results and may even fail to operate. Correct operation will resume once the calculator is brought back to normal temperature.
Be sure to keep physical records of all important data! The large memory capacity of the unit makes it possible to store large amounts of data. You should note, however, that low battery power or incorrect replacement of the batteries that power the unit can cause the data stored in memory to be corrupted or even lost entirely. Stored data can also be affected by strong electrostatic charge or strong impact.
• • • • • • • • • • • • • • • • • • • • • • • • • • • • • • • • • • • • • • • • • • • • • • • • • • • • • • • • • • • • • • • • • • • • • • • • • • • • • • • • • • • • • • • • • • • • • • • • • • • • • • • • • • • • • • • • • • CFX-9970G • • • • • • • • • • • • • • • • • • • • • • • • • • • • • • • • • • • • • • • • • • • • • • • • • • • • • • • • • • • • • • • • • • • • • • • • • • • • • • • • • • • • • • • • • • • • • • • • • • • • • • • • • • • • • • • • • • • • • • • • • •
Contents Getting Acquainted — Read This First! ............................................................. 1 1. 2. 3. 4. 5. Key Markings ....................................................................................................... 2 Selecting Icons and Entering Modes .................................................................... 3 Display ................................................................................................................. 8 Color Adjustment ...................
Contents Chapter 7 Equation Calculations ................................................................... 99 7-1 7-2 7-3 7-4 7-5 Before Beginning an Equation Calculation ................................................ Linear Equations with Two to Six Unknowns ............................................. Quadratic and Cubic Equations ................................................................. Solve Calculations .....................................................................................
Contents Chapter 15 Table & Graph .............................................................................. 205 15-1 15-2 15-3 15-4 15-5 Before Using Table & Graph ...................................................................... Storing a Function and Generating a Numeric Table ................................ Editing and Deleting Functions .................................................................. Editing Tables and Drawing Graphs ........................................................
Contents Chapter 20 Algebraic Expressions ................................................................ 349 20-1 20-2 20-3 20-4 20-5 20-6 20-7 Before Using the Algebraic Mode .............................................................. Inputting and Executing Calculations ........................................................ ALGBR Mode Commands ......................................................................... Signum Function ..................................................................
Contents Appendix ........................................................................................................... 443 Appendix A Resetting the Calculator ................................................................. Appendix B Power Supply ................................................................................. Appendix C Error Message Table ...................................................................... Appendix D Input Ranges ................................................
Getting Acquainted About this User’s Guide uFunction Keys and Menus • Many of the operations performed by this calculator can be executed by pressing function keys 1 through 6. The operation assigned to each function key changes according to the mode the calculator is in, and current operation assignments are indicated by function menus that appear at the bottom of the display.
1. Key Markings Many of the calculator’s keys are used to perform more than one function. The functions marked on the keyboard are color coded to help you find the one you need quickly and easily. Function Key Operation 1 log l 2 10 x !l 3 B al The following describes the color coding used for key markings. Color Key Operation Orange Press ! and then the key to perform the marked function. Red Press a and then the key to perform the marked function.
2. Selecting Icons and Entering Modes This section describes how to select an icon in the Main Menu to enter the mode you want. uTo select an icon 1. Press m to display the Main Menu. Currently selected icon 2. Use the cursor keys (d, e, f, c) to move the highlighting to the icon you want. 3. Press w to display the initial screen of the mode whose icon you selected.
2 Selecting Icons and Entering Modes Icon Mode Name Description TABLE Use this mode to store functions, to generate a numeric table of different solutions as the values assigned to variables in a function change, and to draw graphs. RECURsion Use this mode to store recursion formulas, to generate a numeric table of different solutions as the values assigned to variables in a function change, and to draw graphs. CONICS Use this mode to draw graphs of implicit functions.
Selecting Icons and Entering Modes 2 1 2 3 4 5 3. Use the f and c cursor keys to move the highlighting to the item whose setting you want to change. 4. Press the function key (1 to 6) that is marked with the setting you want to make. 5. After you are finished making any changes you want, press J to return to the initial screen of the mode. k Set Up Screen Function Key Menus This section details the settings you can make using the function keys in the set up display.
2 Selecting Icons and Entering Modes uGrid (graph gridline display) P.121 • {On}/{Off} ... {display on}/{display off} uAxes (graph axis display) P.121 • {On}/{Off} ... {display on}/{display off} uLabel (graph axis label display) P.121 • {On}/{Off} ... {display on}/{display off} uDisplay (display format) P.14 P.15 • {Fix}/{Sci}/{Norm}/{Eng} ...
Selecting Icons and Entering Modes 2 uDual Screen (Dual Screen Mode status) The Dual Screen Mode settings you can make depends on whether you pressed !Z while in the GRAPH Mode, TABLE Mode, or RECUR Mode. GRAPH Mode P.168 P.176 • {Grph}/{GtoT}/{Off} ... {graphing on both sides of Dual Screen}/{graph on one side and numeric table on the other side of Dual Screen}/{Dual Screen off} TABLE/RECUR Mode P.215 • {T+G}/{Off} ...
2 Selecting Icons and Entering Modes 3. Display k About the Display Screen This calculator uses two types of display: a text display and a graphic display. The text display can show 21 columns and eight lines of characters, with the bottom line used for the function key menu, while the graph display uses an area that measures 127 (W) × 63 (H) dots. Text Display Graph Display k About Display Colors [OPTN]-[COLR] The calculator can display data in three colors: orange, blue, and green.
Display 3 • Direct Command Execution Example: Selecting executes the DRAW command. k Exponential Display The calculator normally displays values up to 10 digits long. Values that exceed this limit are automatically converted to and displayed in exponential format. You can specify one of two different ranges for automatic changeover to exponential display. Norm 1 ........... 10–2 (0.01) > |x|, |x| > 1010 Norm 2 ........... 10–9 (0.000000001) > |x|, |x| > 1010 uTo change the exponential display range 1.
3 Display k Special Display Formats This calculator uses special display formats to indicate fractions, hexadecimal values, and sexagesimal values. uFractions 12 ..... Indicates: 456 –––– 23 uHexadecimal Values ..... Indicates: ABCDEF12(16), which equals –1412567278(10) uSexagesimal Values ..... Indicates: 12° 34’ 56.78" • In addition to the above, this calculator also uses other indicators or symbols, which are described in each applicable section of this manual as they come up.
4. Color Adjustment Adjust the color whenever objects on the display appear dim or difficult to see. There are two different settings you can make to get color the way you want it. • Color contrast • Tint adjustment for each color uTo display the color adjustment screen 1. Highlight the SYS icon in the Main Menu and then press w. 2. Highlight Color Contrast and then press w. • {INIT}/{IN·A} ...
5. When you keep having problems… If you keep having problems when you are trying to perform operations, try the following before assuming that there is something wrong with the calculator. k Get the Calculator Back to its Original Mode Settings 1. In the Main Menu, select the RUN icon and press w. 2. Press ! Z to display the set up screen. 3. Highlight “Angle” and press 2 (Rad). 4. Highlight “Display” and press 3 (Norm) to select the exponential display range (Norm 1 or Norm 2) that you want to use. P.