
User Guide
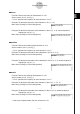

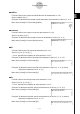

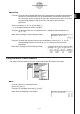


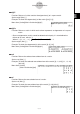

Table Of Contents
- Getting Ready
- Contents
- About This User’s Guide
- Chapter 1 Getting Acquainted
- Chapter 2 Using the Main Application
- 2-1 Main Application Overview
- 2-2 Basic Calculations
- 2-3 Using the Calculation History
- 2-4 Function Calculations
- 2-5 List Calculations
- 2-6 Matrix and Vector Calculations
- 2-7 Using the Action Menu
- 2-8 Using the Interactive Menu
- 2-9 Using the Main Application in Combination with Other Applications
- 2-10 Using Verify
- Chapter 3 Using the Graph & Table Application
- Chapter 4 Using the Conics Application
- Chapter 5 Using the 3D Graph Application
- Chapter 6 Using the Sequence Application
- Chapter 7 Using the Statistics Application
- 7-1 Statistics Application Overview
- 7-2 Using List Editor
- 7-3 Before Trying to Draw a Statistical Graph
- 7-4 Graphing Single-Variable Statistical Data
- 7-5 Graphing Paired-Variable Statistical Data
- 7-6 Using the Statistical Graph Window Toolbar
- 7-7 Performing Statistical Calculations
- 7-8 Test, Confidence Interval, and Distribution Calculations
- 7-9 Tests
- 7-10 Confidence Intervals
- 7-11 Distribution
- 7-12 Statistical System Variables
- Chapter 8 Using the Geometry Application
- Chapter 9 Using the Numeric Solver Application
- Chapter 10 Using the eActivity Application
- Chapter 11 Using the Presentation Application
- Chapter 12 Using the Program Application
- Chapter 13 Using the Spreadsheet Application
- Chapter 14 Using the Setup Menu
- Chapter 15 Configuring System Settings
- 15-1 System Setting Overview
- 15-2 Managing Memory Usage
- 15-3 Using the Reset Dialog Box
- 15-4 Initializing Your ClassPad
- 15-5 Adjusting Display Contrast
- 15-6 Configuring Power Properties
- 15-7 Specifying the Display Language
- 15-8 Specifying the Font Set
- 15-9 Specifying the Alphabetic Keyboard Arrangement
- 15-10 Optimizing “Flash ROM”
- 15-11 Specifying the Ending Screen Image
- 15-12 Adjusting Touch Panel Alignment
- 15-13 Viewing Version Information
- Chapter 16 Performing Data Communication
- Appendix
20050501
2-7-25
Using the Action Menu
uu
uu
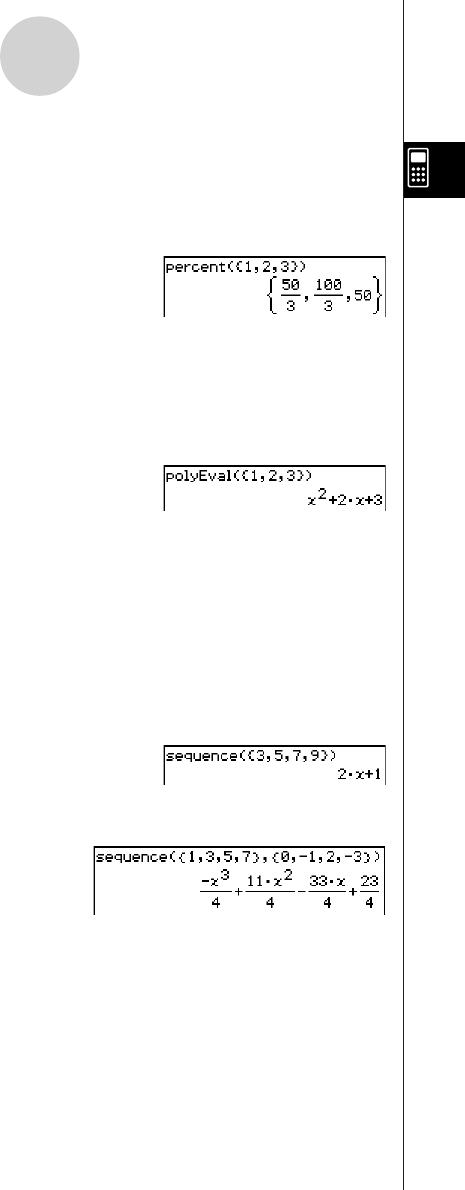
u percent
Function: Returns the percentage of each element in a list, the sum of which is assumed
to be 100.
Syntax: percent (List [
)
]
Example: To determine the percentage of each element in the list {1, 2, 3}
Menu Item: [Action][List-Calculation][percent]
uu
uu
u polyEval
Function: Returns a polynomial arranged in the descending order of powers, so
coefficients correspond sequentially to each element in the input list.
Syntax: polyEval (List [,Exp/List] [
) ]
Example: To create a second degree polynomial with the coefficients {1, 2, 3}
Menu Item: [Action][List-Calculation][polyEval]
•“x” is the default when you omit “[,Exp/List]”.
uu
uu
u sequence
Function: Returns the lowest-degree polynomial that represents the sequence expressed
by the input list. When there are two lists, this command returns a polynomial
that maps each element in the first list to its corresponding element in the
second list.
Syntax: sequence (List-1[, List-2] [,variable] [
)
]
•“x” is the default when you omit “[,variable]”.
Example: To determine a polynomial for a sequence expressed by the list {3, 5, 7, 9}
Menu Item: [Action][List-Calculation][sequence]
Example: To determine a polynomial that maps each element in the list {1, 3, 5, 7} to its
corresponding element in the list {0, –1, 2, –3}.
Menu Item: [Action][List-Calculation][sequence]