
User Guide
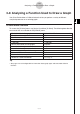

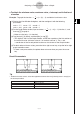


Table Of Contents
- Getting Ready
- Contents
- About This User’s Guide
- Chapter 1 Getting Acquainted
- Chapter 2 Using the Main Application
- 2-1 Main Application Overview
- 2-2 Basic Calculations
- 2-3 Using the Calculation History
- 2-4 Function Calculations
- 2-5 List Calculations
- 2-6 Matrix and Vector Calculations
- 2-7 Using the Action Menu
- 2-8 Using the Interactive Menu
- 2-9 Using the Main Application in Combination with Other Applications
- 2-10 Using Verify
- Chapter 3 Using the Graph & Table Application
- Chapter 4 Using the Conics Application
- Chapter 5 Using the 3D Graph Application
- Chapter 6 Using the Sequence Application
- Chapter 7 Using the Statistics Application
- 7-1 Statistics Application Overview
- 7-2 Using List Editor
- 7-3 Before Trying to Draw a Statistical Graph
- 7-4 Graphing Single-Variable Statistical Data
- 7-5 Graphing Paired-Variable Statistical Data
- 7-6 Using the Statistical Graph Window Toolbar
- 7-7 Performing Statistical Calculations
- 7-8 Test, Confidence Interval, and Distribution Calculations
- 7-9 Tests
- 7-10 Confidence Intervals
- 7-11 Distribution
- 7-12 Statistical System Variables
- Chapter 8 Using the Geometry Application
- Chapter 9 Using the Numeric Solver Application
- Chapter 10 Using the eActivity Application
- Chapter 11 Using the Presentation Application
- Chapter 12 Using the Program Application
- Chapter 13 Using the Spreadsheet Application
- Chapter 14 Using the Setup Menu
- Chapter 15 Configuring System Settings
- 15-1 System Setting Overview
- 15-2 Managing Memory Usage
- 15-3 Using the Reset Dialog Box
- 15-4 Initializing Your ClassPad
- 15-5 Adjusting Display Contrast
- 15-6 Configuring Power Properties
- 15-7 Specifying the Display Language
- 15-8 Specifying the Font Set
- 15-9 Specifying the Alphabetic Keyboard Arrangement
- 15-10 Optimizing “Flash ROM”
- 15-11 Specifying the Ending Screen Image
- 15-12 Adjusting Touch Panel Alignment
- 15-13 Viewing Version Information
- Chapter 16 Performing Data Communication
- Appendix
20050501
u To determine the distance between any two points
(1) Tap the Graph window to make it active.
(2) Tap [Analysis], [G-Solve], and then [Distance].
• This displays “Distance” on the Graph window, and the ClassPad waits for you to
specify the first point.
(3) Tap the first point on the Graph window.
• This causes a pointer to appear at the location where you tap.
(4) Tap the second point on the Graph window.
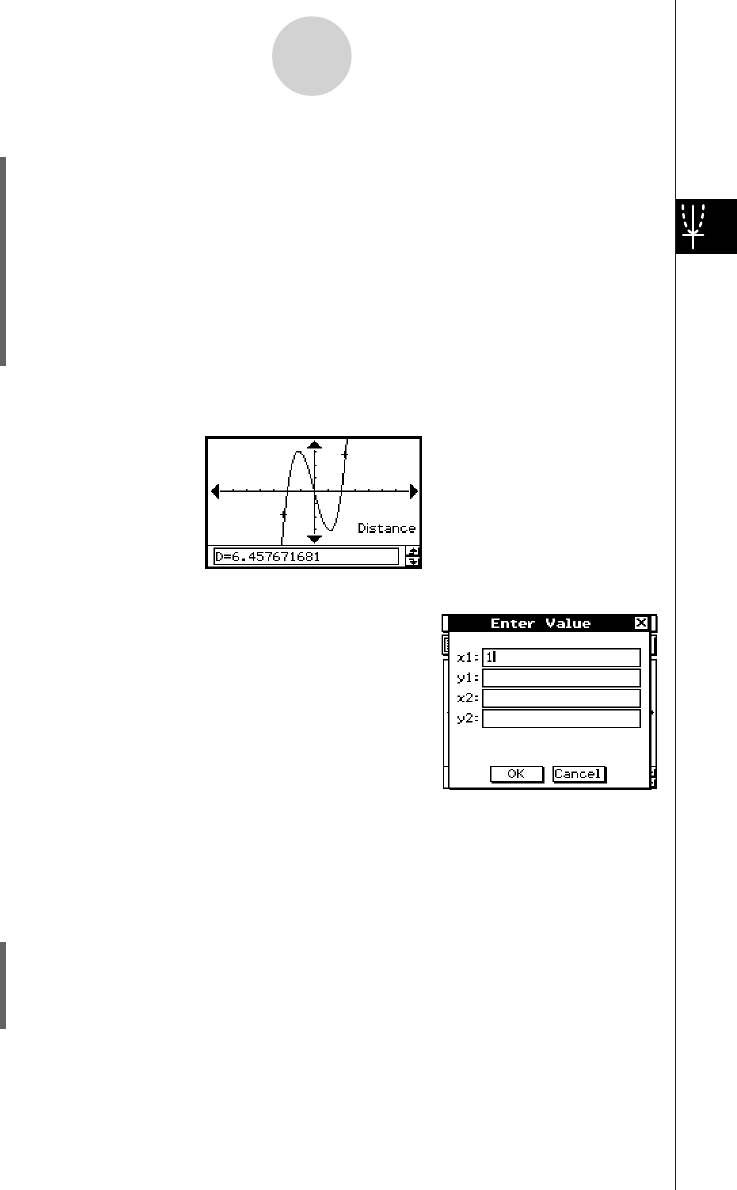
• This causes a pointer to appear at the second point, and the distance between the
two points to appear in the message box.
Result Screenshot
3-8-7
Analyzing a Function Used to Draw a Graph
Tip
• Instead of tapping points on the Graph window, you could also
specify points by inputting their coordinates. Without tapping
the Graph window, input a value. This causes a coordinate
specification dialog box to appear. Input the x- and
y-coordinates of the two points.
u To determine the inflection point
You can use the following procedure to determine coordinates of the inflection point for a
cubic function.
Example: To graph the function y = x
3
– 1 and determine its inflection point
u ClassPad Operation
(1) Display the View Window dialog box, and then configure it with the following
parameters.
xmin = –4.9, xmax = 4.9, xscale = 1
ymin = –3.3, ymax = 1.8, yscale = 1