
User Guide
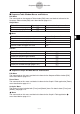
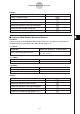
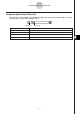


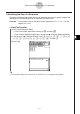
Table Of Contents
- Getting Ready
- Contents
- About This User’s Guide
- Chapter 1 Getting Acquainted
- Chapter 2 Using the Main Application
- 2-1 Main Application Overview
- 2-2 Basic Calculations
- 2-3 Using the Calculation History
- 2-4 Function Calculations
- 2-5 List Calculations
- 2-6 Matrix and Vector Calculations
- 2-7 Using the Action Menu
- 2-8 Using the Interactive Menu
- 2-9 Using the Main Application in Combination with Other Applications
- 2-10 Using Verify
- Chapter 3 Using the Graph & Table Application
- Chapter 4 Using the Conics Application
- Chapter 5 Using the 3D Graph Application
- Chapter 6 Using the Sequence Application
- Chapter 7 Using the Statistics Application
- 7-1 Statistics Application Overview
- 7-2 Using List Editor
- 7-3 Before Trying to Draw a Statistical Graph
- 7-4 Graphing Single-Variable Statistical Data
- 7-5 Graphing Paired-Variable Statistical Data
- 7-6 Using the Statistical Graph Window Toolbar
- 7-7 Performing Statistical Calculations
- 7-8 Test, Confidence Interval, and Distribution Calculations
- 7-9 Tests
- 7-10 Confidence Intervals
- 7-11 Distribution
- 7-12 Statistical System Variables
- Chapter 8 Using the Geometry Application
- Chapter 9 Using the Numeric Solver Application
- Chapter 10 Using the eActivity Application
- Chapter 11 Using the Presentation Application
- Chapter 12 Using the Program Application
- Chapter 13 Using the Spreadsheet Application
- Chapter 14 Using the Setup Menu
- Chapter 15 Configuring System Settings
- 15-1 System Setting Overview
- 15-2 Managing Memory Usage
- 15-3 Using the Reset Dialog Box
- 15-4 Initializing Your ClassPad
- 15-5 Adjusting Display Contrast
- 15-6 Configuring Power Properties
- 15-7 Specifying the Display Language
- 15-8 Specifying the Font Set
- 15-9 Specifying the Alphabetic Keyboard Arrangement
- 15-10 Optimizing “Flash ROM”
- 15-11 Specifying the Ending Screen Image
- 15-12 Adjusting Touch Panel Alignment
- 15-13 Viewing Version Information
- Chapter 16 Performing Data Communication
- Appendix
20050501
k Sequence Graph Window Menus and Buttons
Edit Menu
The commands on this menu are identical to those for the Sequence Editor window [Edit]
menu described on page 6-1-2.
Zoom Menu
The commands on this menu are identical to those for the Graph & Table application [Zoom]
menu described on page 3-1-4.
Analysis Menu
The [Analysis] menu includes both [Trace] and [Sketch] items. For details about [Trace] and
[Sketch], see page 3-1-5.
a Menu
The commands on this menu are identical to those for the Graph & Table application a
menu described on page 3-1-3.
6-1-4
Sequence Application Overview
Display the Sequence Editor window
Display the Sequence RUN window
Display the Sequence Table Input dialog box
Display the View Window dialog box
`
8
6
5
&
Display the Variable Manager (page 1-8-1)
To do this:
Tap this button:
Buttons
aa
aa
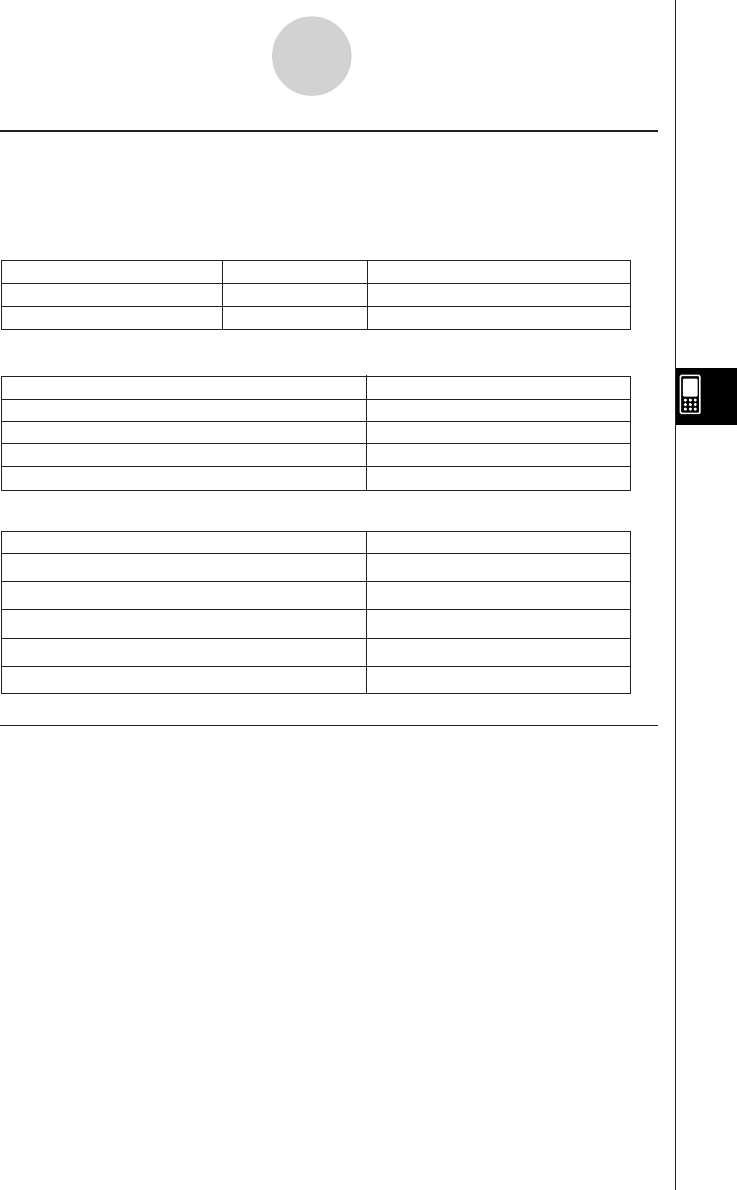
a Menu
Regenerate the currently displayed table
Save the contents of a table to a list
Delete the currently displayed table
Execute a table and graph link trace
ReTable
Ta b le to List
Delete Table
Link
To do this:
Select this a menu item:
k Sequence Table Window Menus and Buttons
Edit Menu
The commands on the sequence Table window [Edit] menu are identical to those for the
Sequence Editor window [Edit] menu described on page 6-1-2.
Graph Menu
Draw a connect type graph
Draw a plot type graph
G-Connect
G-Plot
To do this:
Tap this button:
Or select this Graph menu item:
$
!