
User Guide


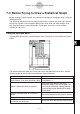
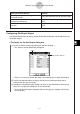


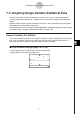
Table Of Contents
- Getting Ready
- Contents
- About This User’s Guide
- Chapter 1 Getting Acquainted
- Chapter 2 Using the Main Application
- 2-1 Main Application Overview
- 2-2 Basic Calculations
- 2-3 Using the Calculation History
- 2-4 Function Calculations
- 2-5 List Calculations
- 2-6 Matrix and Vector Calculations
- 2-7 Using the Action Menu
- 2-8 Using the Interactive Menu
- 2-9 Using the Main Application in Combination with Other Applications
- 2-10 Using Verify
- Chapter 3 Using the Graph & Table Application
- Chapter 4 Using the Conics Application
- Chapter 5 Using the 3D Graph Application
- Chapter 6 Using the Sequence Application
- Chapter 7 Using the Statistics Application
- 7-1 Statistics Application Overview
- 7-2 Using List Editor
- 7-3 Before Trying to Draw a Statistical Graph
- 7-4 Graphing Single-Variable Statistical Data
- 7-5 Graphing Paired-Variable Statistical Data
- 7-6 Using the Statistical Graph Window Toolbar
- 7-7 Performing Statistical Calculations
- 7-8 Test, Confidence Interval, and Distribution Calculations
- 7-9 Tests
- 7-10 Confidence Intervals
- 7-11 Distribution
- 7-12 Statistical System Variables
- Chapter 8 Using the Geometry Application
- Chapter 9 Using the Numeric Solver Application
- Chapter 10 Using the eActivity Application
- Chapter 11 Using the Presentation Application
- Chapter 12 Using the Program Application
- Chapter 13 Using the Spreadsheet Application
- Chapter 14 Using the Setup Menu
- Chapter 15 Configuring System Settings
- 15-1 System Setting Overview
- 15-2 Managing Memory Usage
- 15-3 Using the Reset Dialog Box
- 15-4 Initializing Your ClassPad
- 15-5 Adjusting Display Contrast
- 15-6 Configuring Power Properties
- 15-7 Specifying the Display Language
- 15-8 Specifying the Font Set
- 15-9 Specifying the Alphabetic Keyboard Arrangement
- 15-10 Optimizing “Flash ROM”
- 15-11 Specifying the Ending Screen Image
- 15-12 Adjusting Touch Panel Alignment
- 15-13 Viewing Version Information
- Chapter 16 Performing Data Communication
- Appendix
20050501
u XList
Tap the down arrow button, and then select the name of the list (list1 through list6, or a list
name you assigned) that you want to use for x-axis data.
•You need to specify only an XList in the case of single-variable statistics (page 7-4-1). The
initial default [XList] setting is “list1”.
u YList
Tap the down arrow button, and then select the name of the list (list1 through list6, or a list
name you assigned) that you want to use for y-axis data.
•Specify a YList in addition to an XList in the case of paired-variable statistics (page 7-5-1).
The initial default [YList] setting is “list2”.
7-3-3
Before Trying to Draw a Statistical Graph
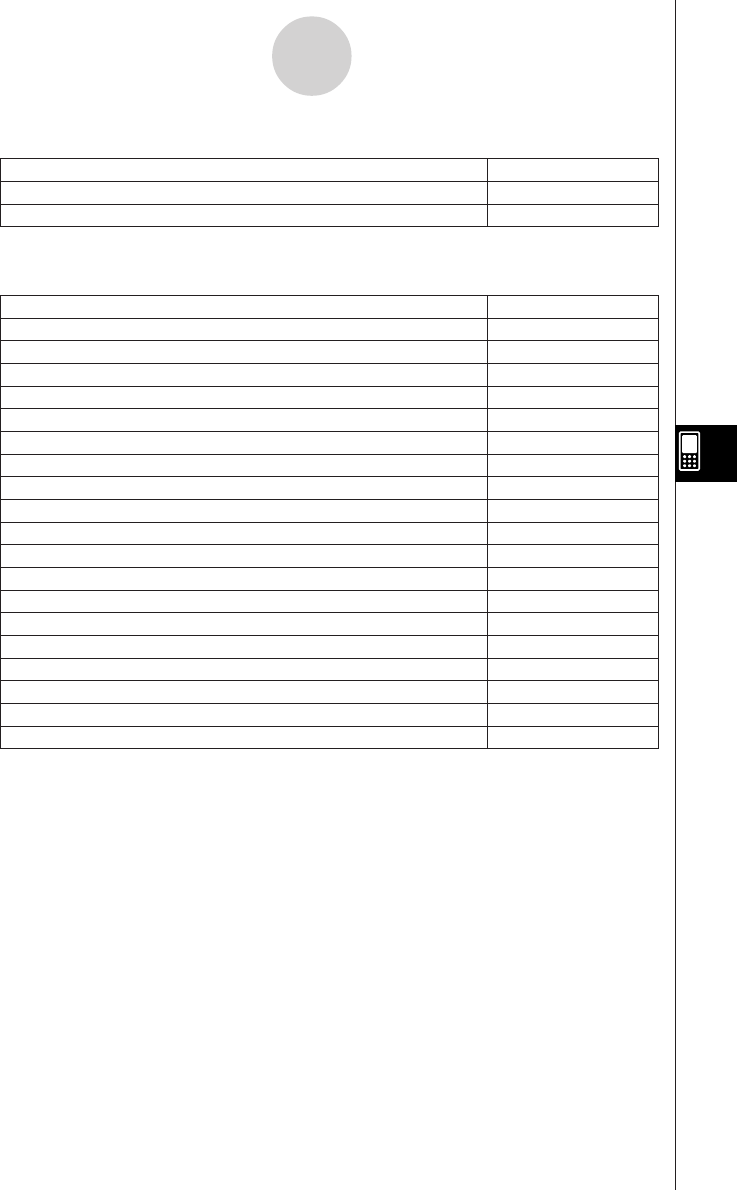
u Draw
Scatter plot
Scatter
xy line graph
xyLine
Normal probability plot
NPPlot
Histogram
Histogram
Med-box plot
MedBox
Modified-box plot
ModBox
Normal distribution curve
NDist
Broken line graph
Broken
Linear regression graph
LinearR
Med-Med graph
MedMed
Quadratic regression graph
QuadR
Cubic regression graph
CubicR
Quartic regression graph
QuartR
Logarithmic regression graph
LogR
Exponential regression graph (y = a
.
e
b
.
x
)
ExpR
Exponential regression graph (y = a
.
b
x
)
abExpR
Power regression graph
PowerR
Sinusoidal regression graph
SinR
Logistic regression graph
LogisticR
Select this option:To draw this type of graph:
Draw the graph using the StatGraph setup of the current tab
Not draw the graph using the StatGraph setup of the current tab
On
Off
Select this option:To do this:
u Type
Tap the down arrow button, and then select the graph type from the list that appears.