
User Guide

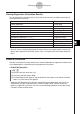
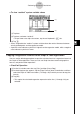

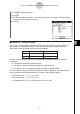


Table Of Contents
- Getting Ready
- Contents
- About This User’s Guide
- Chapter 1 Getting Acquainted
- Chapter 2 Using the Main Application
- 2-1 Main Application Overview
- 2-2 Basic Calculations
- 2-3 Using the Calculation History
- 2-4 Function Calculations
- 2-5 List Calculations
- 2-6 Matrix and Vector Calculations
- 2-7 Using the Action Menu
- 2-8 Using the Interactive Menu
- 2-9 Using the Main Application in Combination with Other Applications
- 2-10 Using Verify
- Chapter 3 Using the Graph & Table Application
- Chapter 4 Using the Conics Application
- Chapter 5 Using the 3D Graph Application
- Chapter 6 Using the Sequence Application
- Chapter 7 Using the Statistics Application
- 7-1 Statistics Application Overview
- 7-2 Using List Editor
- 7-3 Before Trying to Draw a Statistical Graph
- 7-4 Graphing Single-Variable Statistical Data
- 7-5 Graphing Paired-Variable Statistical Data
- 7-6 Using the Statistical Graph Window Toolbar
- 7-7 Performing Statistical Calculations
- 7-8 Test, Confidence Interval, and Distribution Calculations
- 7-9 Tests
- 7-10 Confidence Intervals
- 7-11 Distribution
- 7-12 Statistical System Variables
- Chapter 8 Using the Geometry Application
- Chapter 9 Using the Numeric Solver Application
- Chapter 10 Using the eActivity Application
- Chapter 11 Using the Presentation Application
- Chapter 12 Using the Program Application
- Chapter 13 Using the Spreadsheet Application
- Chapter 14 Using the Setup Menu
- Chapter 15 Configuring System Settings
- 15-1 System Setting Overview
- 15-2 Managing Memory Usage
- 15-3 Using the Reset Dialog Box
- 15-4 Initializing Your ClassPad
- 15-5 Adjusting Display Contrast
- 15-6 Configuring Power Properties
- 15-7 Specifying the Display Language
- 15-8 Specifying the Font Set
- 15-9 Specifying the Alphabetic Keyboard Arrangement
- 15-10 Optimizing “Flash ROM”
- 15-11 Specifying the Ending Screen Image
- 15-12 Adjusting Touch Panel Alignment
- 15-13 Viewing Version Information
- Chapter 16 Performing Data Communication
- Appendix

20050501
Viewing Regression Calculation Results
To view regression calculation results, tap [Calc] on the menu bar and then tap the type of
calculation results you want.
7-7-3
Performing Statistical Calculations
•You can also use the [DispStat] option to display the last calculated statistical results. For
details about regression calculation results, see “7-5 Graphing Paired-Variable Statistical
Data”.
Residual Calculation
Residual calculation calculates the distance (residual) between the regression model and an
actual plotted point (y-coordinates) during regression calculations.
u ClassPad Operation
(1) m I
(2) Input the data you want into a list.
(3) Tap [Calc] and then [Linear Reg].
(4) On the dialog box that appears, tap the [Residual Calc] down arrow button, and then
select “On” from the list that appears.
•Whenever the [Residual Calc] setting is configured as described above, the ClassPad
automatically assigns residual data to a system variable named “residual” when you
perform a regression calculation. You can use the following procedure to view the current
“residual” system variable values.
Linear regression
Linear Reg
Med-Med
MedMed Line
Quadratic regression
Quadratic Reg
Cubic regression
Cubic Reg
Quartic regression
Quartic Reg
Logarithmic regression
Logarithmic Reg
Exponential regression (y = a·e
b
·
x
)
Exponential Reg
Exponential regression (y = a·b
x
)
abExponential Reg
Power regression
Power Reg
Sinusoidal regression
Sinusoidal Reg
Logistic regression
Logistic Reg
Tap this option:To view these calculation results: