
User Guide
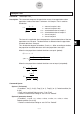
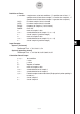


Table Of Contents
- Getting Ready
- Contents
- About This User’s Guide
- Chapter 1 Getting Acquainted
- Chapter 2 Using the Main Application
- 2-1 Main Application Overview
- 2-2 Basic Calculations
- 2-3 Using the Calculation History
- 2-4 Function Calculations
- 2-5 List Calculations
- 2-6 Matrix and Vector Calculations
- 2-7 Using the Action Menu
- 2-8 Using the Interactive Menu
- 2-9 Using the Main Application in Combination with Other Applications
- 2-10 Using Verify
- Chapter 3 Using the Graph & Table Application
- Chapter 4 Using the Conics Application
- Chapter 5 Using the 3D Graph Application
- Chapter 6 Using the Sequence Application
- Chapter 7 Using the Statistics Application
- 7-1 Statistics Application Overview
- 7-2 Using List Editor
- 7-3 Before Trying to Draw a Statistical Graph
- 7-4 Graphing Single-Variable Statistical Data
- 7-5 Graphing Paired-Variable Statistical Data
- 7-6 Using the Statistical Graph Window Toolbar
- 7-7 Performing Statistical Calculations
- 7-8 Test, Confidence Interval, and Distribution Calculations
- 7-9 Tests
- 7-10 Confidence Intervals
- 7-11 Distribution
- 7-12 Statistical System Variables
- Chapter 8 Using the Geometry Application
- Chapter 9 Using the Numeric Solver Application
- Chapter 10 Using the eActivity Application
- Chapter 11 Using the Presentation Application
- Chapter 12 Using the Program Application
- Chapter 13 Using the Spreadsheet Application
- Chapter 14 Using the Setup Menu
- Chapter 15 Configuring System Settings
- 15-1 System Setting Overview
- 15-2 Managing Memory Usage
- 15-3 Using the Reset Dialog Box
- 15-4 Initializing Your ClassPad
- 15-5 Adjusting Display Contrast
- 15-6 Configuring Power Properties
- 15-7 Specifying the Display Language
- 15-8 Specifying the Font Set
- 15-9 Specifying the Alphabetic Keyboard Arrangement
- 15-10 Optimizing “Flash ROM”
- 15-11 Specifying the Ending Screen Image
- 15-12 Adjusting Touch Panel Alignment
- 15-13 Viewing Version Information
- Chapter 16 Performing Data Communication
- Appendix
20050501
Linear Regression t Test
Command: LinRegTTest 䡺
Description: This command treats two groups of data as paired variables (x, y). The method
of least squares is used to determine the most appropriate pair for the a, b
coefficients of the regression formula y = a + b
.
x. It also determines the
correlation coefficient and t value, and calculates the strength of the
relationship between x and y.
a : regression constant term (y-intercept)
b : regression coefficient (slope)
n : sample size (n > 3)
r : correlation coefficient
r
2
: coefficient of determination
Command Syntax
“
β
&
ρ
condition”, XList, YList, Freq (or 1)
* “Freq” can be omitted. Doing so sets “1” for “Freq”.
Definition of Terms
β
&
ρ
condition : test conditions (“≠” specifies two-tail test, “<” specifies lower
one-tail test, “>” specifies upper one-tail test.)
XList : x-data list
YList : y-data list
Freq : frequency (1 or list name)
Input Example:
LinRegTTest “≠”,list1,list2,1
Calculation Result Output
β
≠ 0 &
ρ
≠ 0 : test condition
t : t value
p : p-value
df : degrees of freedom
a : regression constant term (y-intercept)
b : regression coefficient (slope)
s : standard error of estimation
r : correlation coefficient
r
2
: coefficient of determination
7-9-9
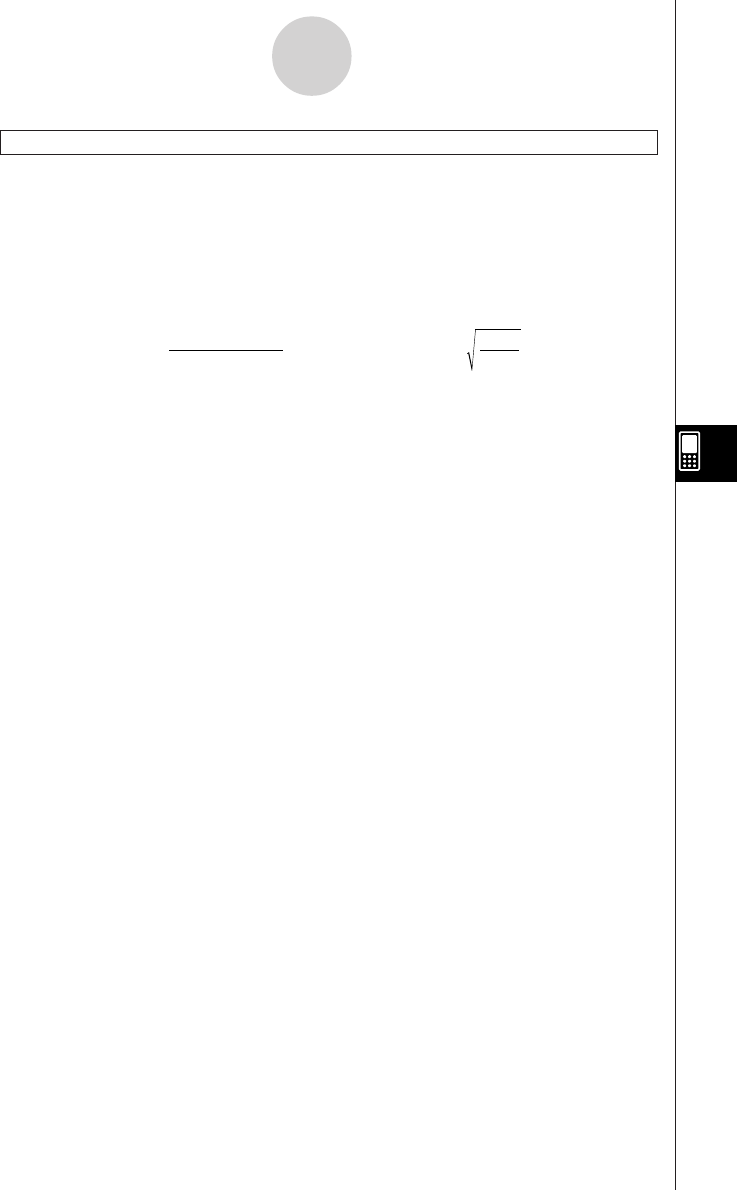
Tests
b =
Σ
( x – o)( y – p)
i=1
n
Σ
(x – o)
2
i=1
n
a = p – b
.
o t = r
n – 2
1 – r
2