
User Guide


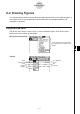
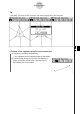


Table Of Contents
- Getting Ready
- Contents
- About This User’s Guide
- Chapter 1 Getting Acquainted
- Chapter 2 Using the Main Application
- 2-1 Main Application Overview
- 2-2 Basic Calculations
- 2-3 Using the Calculation History
- 2-4 Function Calculations
- 2-5 List Calculations
- 2-6 Matrix and Vector Calculations
- 2-7 Using the Action Menu
- 2-8 Using the Interactive Menu
- 2-9 Using the Main Application in Combination with Other Applications
- 2-10 Using Verify
- Chapter 3 Using the Graph & Table Application
- Chapter 4 Using the Conics Application
- Chapter 5 Using the 3D Graph Application
- Chapter 6 Using the Sequence Application
- Chapter 7 Using the Statistics Application
- 7-1 Statistics Application Overview
- 7-2 Using List Editor
- 7-3 Before Trying to Draw a Statistical Graph
- 7-4 Graphing Single-Variable Statistical Data
- 7-5 Graphing Paired-Variable Statistical Data
- 7-6 Using the Statistical Graph Window Toolbar
- 7-7 Performing Statistical Calculations
- 7-8 Test, Confidence Interval, and Distribution Calculations
- 7-9 Tests
- 7-10 Confidence Intervals
- 7-11 Distribution
- 7-12 Statistical System Variables
- Chapter 8 Using the Geometry Application
- Chapter 9 Using the Numeric Solver Application
- Chapter 10 Using the eActivity Application
- Chapter 11 Using the Presentation Application
- Chapter 12 Using the Program Application
- Chapter 13 Using the Spreadsheet Application
- Chapter 14 Using the Setup Menu
- Chapter 15 Configuring System Settings
- 15-1 System Setting Overview
- 15-2 Managing Memory Usage
- 15-3 Using the Reset Dialog Box
- 15-4 Initializing Your ClassPad
- 15-5 Adjusting Display Contrast
- 15-6 Configuring Power Properties
- 15-7 Specifying the Display Language
- 15-8 Specifying the Font Set
- 15-9 Specifying the Alphabetic Keyboard Arrangement
- 15-10 Optimizing “Flash ROM”
- 15-11 Specifying the Ending Screen Image
- 15-12 Adjusting Touch Panel Alignment
- 15-13 Viewing Version Information
- Chapter 16 Performing Data Communication
- Appendix
20050501
k Other Buttons
The two operations described below are available from the toolbar only. There is no corre-
sponding menu command for these buttons.
8-1-5
Geometry Application Overview
Activate Select (page 8-3-1)
Tap G and then tap the figure.
Move a selected figure
Tap G and then drag the figure.
Activate Toggle Select (page 8-3-2)
Tap i and then tap the figure.
Do this:
To do this
k Draw Menu
To do this:
Select this Draw menu item:
Point
Line Segment
Infinite Line
Vector
Circle
Arc
Ellipse
Function
Polygon
Display a submenu for drawing a figure of specially
shaped figures (page 8-2-9)
Special Shape
Display a submenu for geometric constructions
(page 8-2-12)
Construct
Draw a figure (page 8-2-1)
Tapping a button highlights it, indicating that the button’s function is turned on.
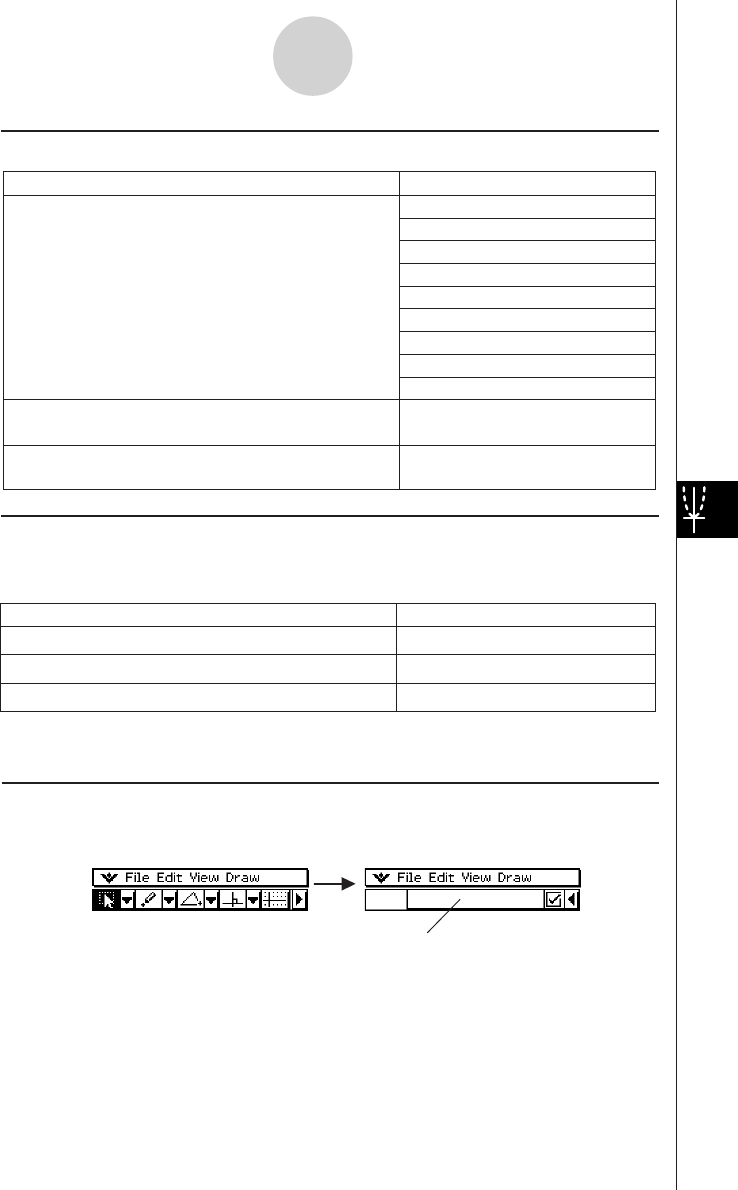
k About the Measurement Box
Tapping the u button to the right of the toolbar takes you to the measurement box. Tap t to
return to the normal toolbar.
Normal toolbar Measurement box
For more information about the measurement box, see “Using the Measurement Box” on
page 8-3-4.