
User Guide

Table Of Contents
- Getting Ready
- Contents
- About This User’s Guide
- Chapter 1 Getting Acquainted
- Chapter 2 Using the Main Application
- 2-1 Main Application Overview
- 2-2 Basic Calculations
- 2-3 Using the Calculation History
- 2-4 Function Calculations
- 2-5 List Calculations
- 2-6 Matrix and Vector Calculations
- 2-7 Using the Action Menu
- 2-8 Using the Interactive Menu
- 2-9 Using the Main Application in Combination with Other Applications
- 2-10 Using Verify
- Chapter 3 Using the Graph & Table Application
- Chapter 4 Using the Conics Application
- Chapter 5 Using the 3D Graph Application
- Chapter 6 Using the Sequence Application
- Chapter 7 Using the Statistics Application
- 7-1 Statistics Application Overview
- 7-2 Using List Editor
- 7-3 Before Trying to Draw a Statistical Graph
- 7-4 Graphing Single-Variable Statistical Data
- 7-5 Graphing Paired-Variable Statistical Data
- 7-6 Using the Statistical Graph Window Toolbar
- 7-7 Performing Statistical Calculations
- 7-8 Test, Confidence Interval, and Distribution Calculations
- 7-9 Tests
- 7-10 Confidence Intervals
- 7-11 Distribution
- 7-12 Statistical System Variables
- Chapter 8 Using the Geometry Application
- Chapter 9 Using the Numeric Solver Application
- Chapter 10 Using the eActivity Application
- Chapter 11 Using the Presentation Application
- Chapter 12 Using the Program Application
- Chapter 13 Using the Spreadsheet Application
- Chapter 14 Using the Setup Menu
- Chapter 15 Configuring System Settings
- 15-1 System Setting Overview
- 15-2 Managing Memory Usage
- 15-3 Using the Reset Dialog Box
- 15-4 Initializing Your ClassPad
- 15-5 Adjusting Display Contrast
- 15-6 Configuring Power Properties
- 15-7 Specifying the Display Language
- 15-8 Specifying the Font Set
- 15-9 Specifying the Alphabetic Keyboard Arrangement
- 15-10 Optimizing “Flash ROM”
- 15-11 Specifying the Ending Screen Image
- 15-12 Adjusting Touch Panel Alignment
- 15-13 Viewing Version Information
- Chapter 16 Performing Data Communication
- Appendix
20050501
12-6-4
Program Command Reference
GetPen
Syntax: GetPen䡺<variable name 1>, <variable name 2>
Function: This command assigns the coordinates of the point tapped on the screen to a
specified variable.
Description
This command assigns the x-coordinate (horizontal axis) to <variable 1> and the
y-coordinate (vertical axis) to <variable 2>. The coordinates at the point in the upper left
corner of the screen are (1, 1), and coordinate values are specified in the range of 1 to 160
for the x-coordinate and 1 to 240 for the y-coordinate.
Input
Syntax: Input
䡺
<variable name>[,"<string 1>"[,"<string 2>"]]
Function: When program execution reaches the Input command, the user is prompted for
input of a value, which is assigned to the specified variable.
Description
• If you do not specify anything for "<string 1>", the prompt “<variable name>?” appears by
default.
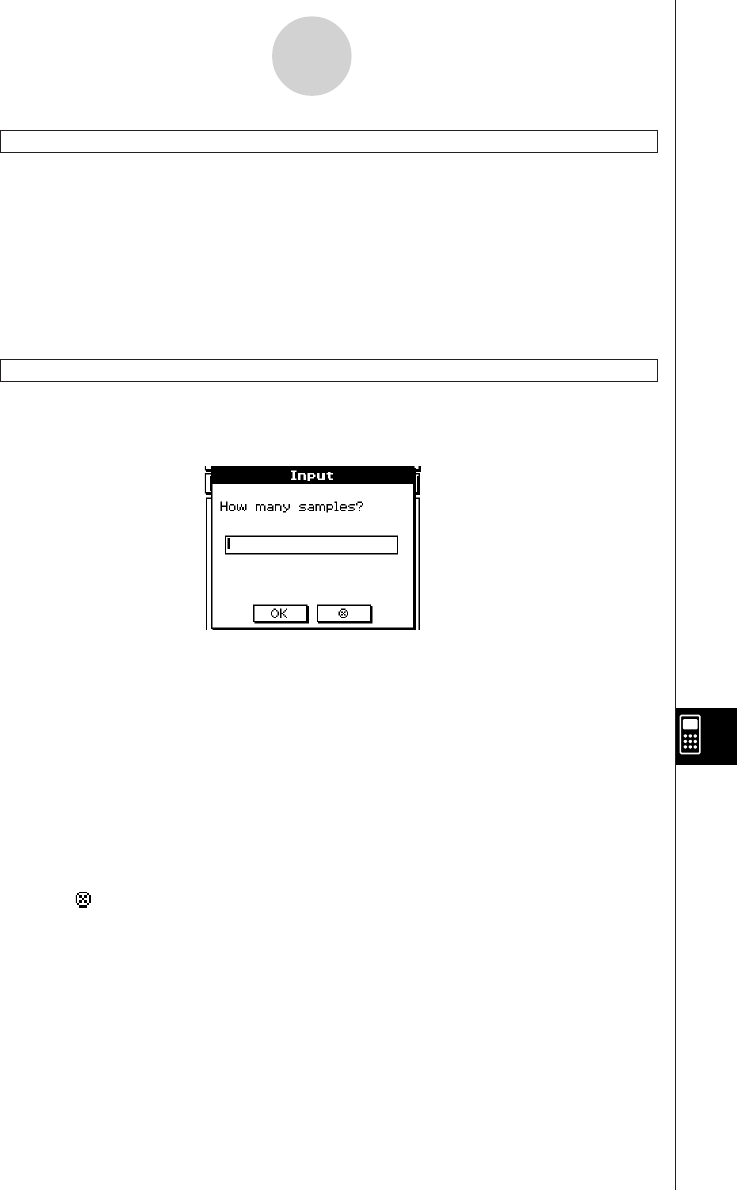
• The text specified for "<string 2>" is used as the input dialog box title.
• The Input command pauses program execution and displays a dialog box that contains the
text string indicated by "<string 1>" and an input box. A text string enclosed within quotation
marks (" ") or a variable name can be specified for "<string 1>".
•Specifying a long text string can cause part of it to be cut off when it is displayed in the
dialog box.
•When the dialog box appears, input a value into the input box and then tap [OK]. This
closes the dialog box, assigns the input value to the applicable variable and resumes
program execution.
•Tapping [ ] on the dialog box terminates program execution.
•During execution of the Input command, program execution is paused for input of data.
While a program is paused, you can input individual mathematical expressions only. You
cannot input commands or multiple expressions joined by colons (:).