
User Manual

20060301
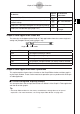
Example 1: To input the function
y
= 3
x
2
on Sheet 1 and graph it
S\
ClassPad Operation
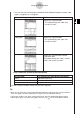
(1) On the application menu, tap
$
.
• This starts the Graph & Table application.
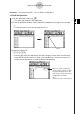
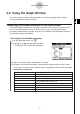
(2) In the Graph Editor window, tap the input box immediately to the right of line number
y
1.
• This locates the cursor in the input box for line
y
1.
3-1-8
Graph & Table Application Overview
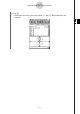
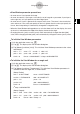
(3) Input the expression.
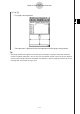
7:
• Pressing
stores the expression you input and puts a check mark into the check
box to the left of line number
y1. When a line number has a check mark next to it, it
means that the expression is currently selected for graphing.
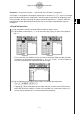
When you input an expression,
the line style that will be used for
the graph will appear here. See
page 3-3-8 for information about
configuring line settings.
Hint:
Tap the line that is circled above!
Cursor