
User Manual

20090601
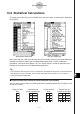
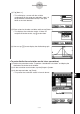
(4) Tap [Next >>].
• This will display a screen with the variable
assignments for the range you selected in step 1 of
this procedure entered automatically in the input
fields as the initial defaults.
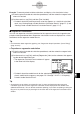
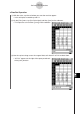
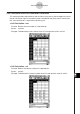
(5) Enter values for the other variables and then tap [Next >>].
• This displays the calculation results. If there are
multiple calculation results, tap
6
to view them.
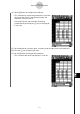
(6) You can tap
here to display the distribution graph.
S
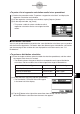
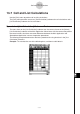
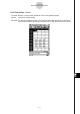
To paste distribution calculation results into a spreadsheet
(1) Perform the procedure under “To perform a distribution calculation” and display the
distribution calculation result window.
(2) On the calculation result window, tap the [Output>>] button.
(3) On the output window, tap [Paste].
• This pastes the calculation results in formula format.
13-6-4
Statistical Calculations