
User Manual

20090601
13-9-1
Graphing
13-9 Graphing
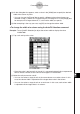
The Spreadsheet application lets you draw a variety of different graphs for analyzing data.
You can combine line and column graphs, and the interactive editing feature lets you change
a graph by dragging its points on the display.
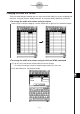
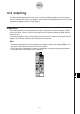
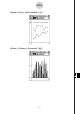
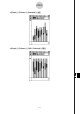
Graph Menu
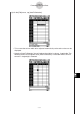
After selecting data on the spreadsheet, use the [Graph] menu to select the type of graph
you want to draw. You can also use the [Graph] menu to specify whether to graph data by
column or row.
The following explains each of the [Graph] menu commands, and shows examples of what
happens to the Graph window when you execute a command.
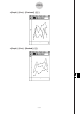
Note
• The following examples show the appearance of graph screens after tapping
2
on the
icon panel so the Graph window fills the entire screen.
• Each command is followed by a button in parentheses to show the graph toolbar button
that performs the same action as the command.