
User Manual
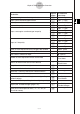
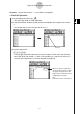
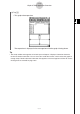
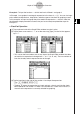
Table Of Contents
- Getting Ready
- Contents
- About This User’s Guide
- Chapter 1 Getting Acquainted
- Chapter 2 Using the Main Application
- 2-1 Main Application Overview
- 2-2 Basic Calculations
- 2-3 Using the Calculation History
- 2-4 Function Calculations
- 2-5 List Calculations
- 2-6 Matrix and Vector Calculations
- 2-7 Using the Action Menu
- 2-8 Using the Interactive Menu
- 2-9 Using the Main Application in Combination with Other Applications
- 2-10 Using Verify
- Chapter 3 Using the Graph & Table Application
- Chapter 4 Using the Conics Application
- Chapter 5 Using the 3D Graph Application
- Chapter 6 Using the Sequence Application
- Chapter 7 Using the Statistics Application
- 7-1 Statistics Application Overview
- 7-2 Using List Editor
- 7-3 Before Trying to Draw a Statistical Graph
- 7-4 Graphing Single-Variable Statistical Data
- 7-5 Graphing Paired-Variable Statistical Data
- 7-6 Using the Statistical Graph Window Toolbar
- 7-7 Performing Statistical Calculations
- 7-8 Test, Confidence Interval, and Distribution Calculations
- 7-9 Tests
- 7-10 Confidence Intervals
- 7-11 Distribution
- 7-12 Statistical System Variables
- Chapter 8 Using the Geometry Application
- Chapter 9 Using the Numeric Solver Application
- Chapter 10 Using the eActivity Application
- Chapter 11 Using the Presentation Application
- Chapter 12 Using the Program Application
- Chapter 13 Using the Spreadsheet Application
- Chapter 14 Using the Setup Menu
- Chapter 15 Configuring System Settings
- 15-1 System Setting Overview
- 15-2 Managing Memory Usage
- 15-3 Using the Reset Dialog Box
- 15-4 Initializing Your ClassPad
- 15-5 Adjusting Display Contrast
- 15-6 Configuring Power Properties
- 15-7 Specifying the Display Language
- 15-8 Specifying the Font Set
- 15-9 Specifying the Alphabetic Keyboard Arrangement
- 15-10 Optimizing “Flash ROM”
- 15-11 Specifying the Ending Screen Image
- 15-12 Adjusting Touch Panel Alignment
- 15-13 Viewing Version Information
- Chapter 16 Performing Data Communication
- Appendix
20050501
3-2-1
Using the Graph Window
3-2 Using the Graph Window
This section explains Graph window operations, including configuring display settings,
scrolling, zooming the image, and more.
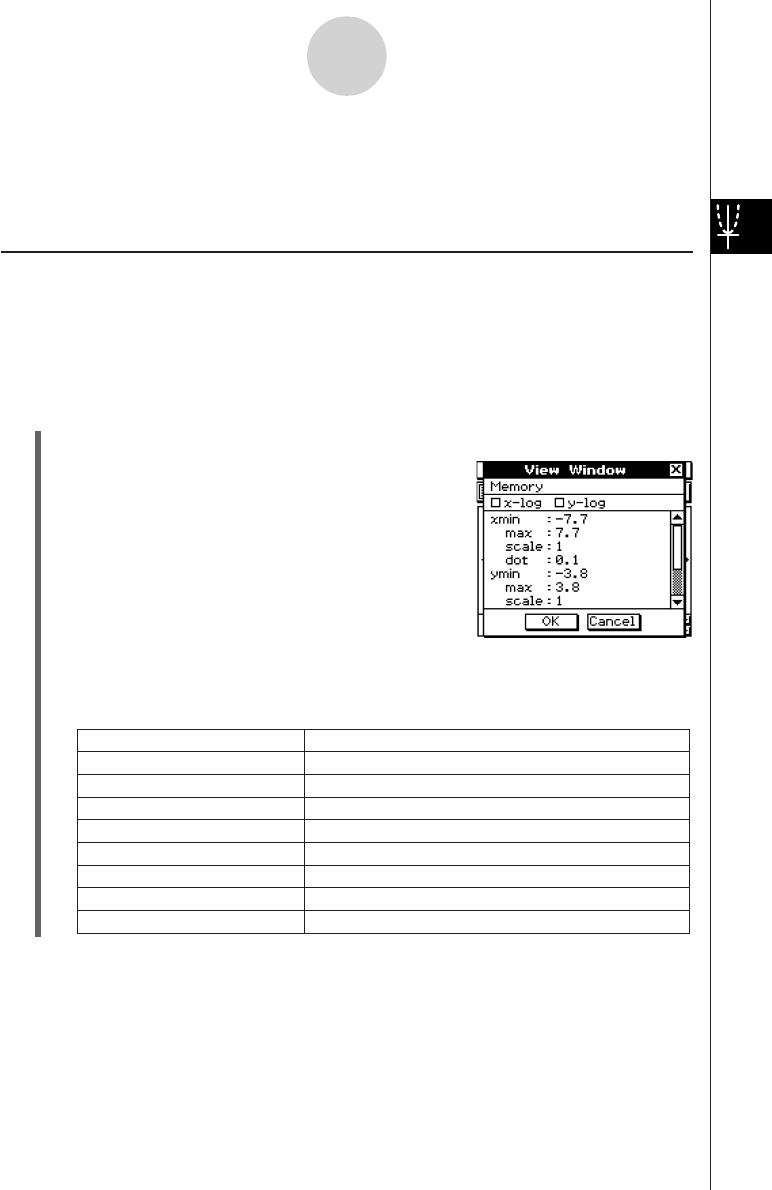
Configuring View Window Parameters for the Graph Window
The View Window dialog box lets you specify the maximum and minimum values for each
axis, the space between the marks on each axis (the scale), and other graph display
parameters. Before drawing a graph, be sure to first configure View Window parameters to
ensure proper display of the graph.
u To configure View Window parameters
(1) On the application menu, tap
T
.
(2) Tap 6, or tap O, [Settings] and then [View Window].
• This displays the View Window dialog box.
(3) Configure View Window parameters required for the type of graph you want to draw.
•Press c to move the cursor and then input an appropriate value for each parameter.
Rectangular Coordinates
Use this item: To configure this View Window parameter:
xmin
xmax
xscale
xdot
ymin
ymax
yscale
ydot
x
-axis minimum value
x
-axis maximum value
x
-axis marker spacing
Value of each dot on the
x
-axis
y
-axis minimum value
y
-axis maximum value
y
-axis marker spacing
Value of each dot on the
y
-axis