
User Manual
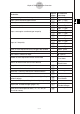
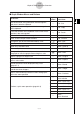
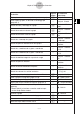
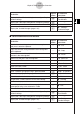
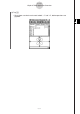
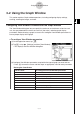
Table Of Contents
- Getting Ready
- Contents
- About This User’s Guide
- Chapter 1 Getting Acquainted
- Chapter 2 Using the Main Application
- 2-1 Main Application Overview
- 2-2 Basic Calculations
- 2-3 Using the Calculation History
- 2-4 Function Calculations
- 2-5 List Calculations
- 2-6 Matrix and Vector Calculations
- 2-7 Using the Action Menu
- 2-8 Using the Interactive Menu
- 2-9 Using the Main Application in Combination with Other Applications
- 2-10 Using Verify
- Chapter 3 Using the Graph & Table Application
- Chapter 4 Using the Conics Application
- Chapter 5 Using the 3D Graph Application
- Chapter 6 Using the Sequence Application
- Chapter 7 Using the Statistics Application
- 7-1 Statistics Application Overview
- 7-2 Using List Editor
- 7-3 Before Trying to Draw a Statistical Graph
- 7-4 Graphing Single-Variable Statistical Data
- 7-5 Graphing Paired-Variable Statistical Data
- 7-6 Using the Statistical Graph Window Toolbar
- 7-7 Performing Statistical Calculations
- 7-8 Test, Confidence Interval, and Distribution Calculations
- 7-9 Tests
- 7-10 Confidence Intervals
- 7-11 Distribution
- 7-12 Statistical System Variables
- Chapter 8 Using the Geometry Application
- Chapter 9 Using the Numeric Solver Application
- Chapter 10 Using the eActivity Application
- Chapter 11 Using the Presentation Application
- Chapter 12 Using the Program Application
- Chapter 13 Using the Spreadsheet Application
- Chapter 14 Using the Setup Menu
- Chapter 15 Configuring System Settings
- 15-1 System Setting Overview
- 15-2 Managing Memory Usage
- 15-3 Using the Reset Dialog Box
- 15-4 Initializing Your ClassPad
- 15-5 Adjusting Display Contrast
- 15-6 Configuring Power Properties
- 15-7 Specifying the Display Language
- 15-8 Specifying the Font Set
- 15-9 Specifying the Alphabetic Keyboard Arrangement
- 15-10 Optimizing “Flash ROM”
- 15-11 Specifying the Ending Screen Image
- 15-12 Adjusting Touch Panel Alignment
- 15-13 Viewing Version Information
- Chapter 16 Performing Data Communication
- Appendix
20050501
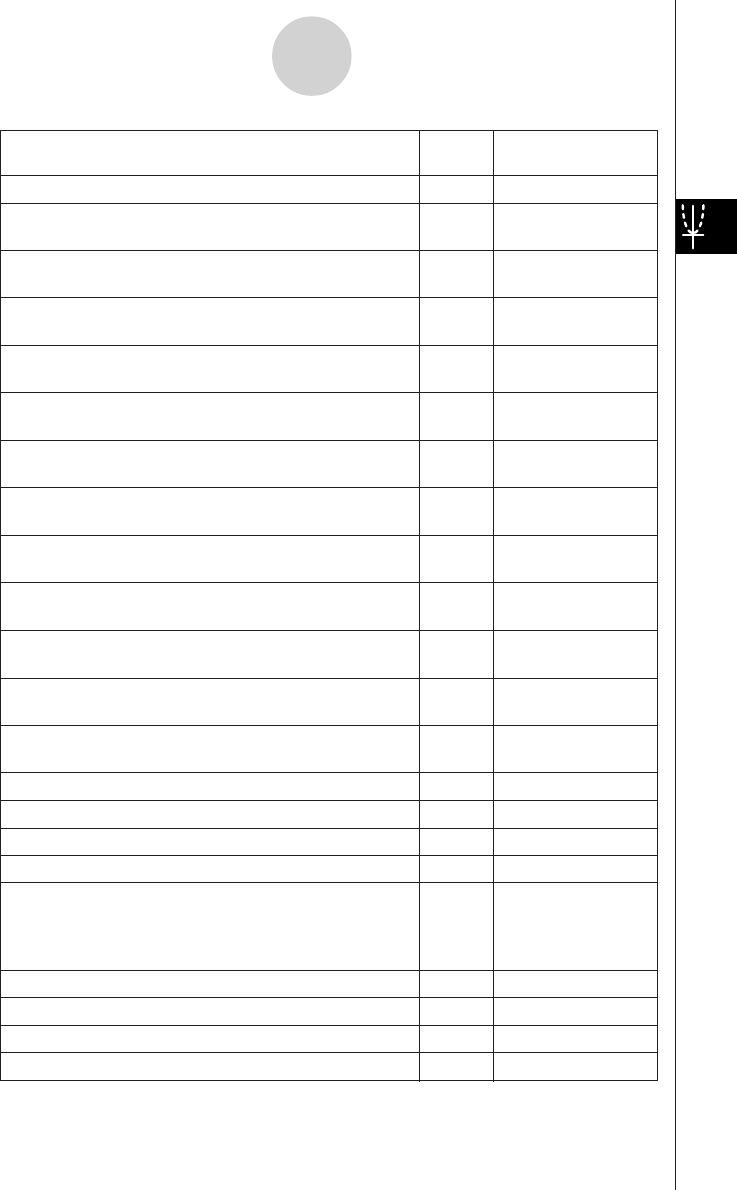
To do this:
Tap this Or select this
button: menu item:
Display the coordinates at a particular point on a graph = Analysis - Trace
Insert a point, graphic, or text into an existing graph
—
Analysis - Sketch
(page 3-6-1)
Obtain the root (x-intercept) of a graph
Y
Analysis - G-Solve -
Root
Obtain the maximum value of a graph
U
Analysis - G-Solve -
Max
Obtain the minimum value of a graph
I
Analysis - G-Solve -
Min
Obtain the y-intercept of a graph
—
Analysis - G-Solve -
y-Intercept
Obtain the point of intersection for two graphs
—
Analysis - G-Solve -
Intersect
Obtain the y-coordinate for a given x-coordinate
—
Analysis - G-Solve -
y-Cal
Obtain the x-coordinate for a given y-coordinate
—
Analysis - G-Solve -
x-Cal
Obtain the definite integral for a particular range
—
Analysis - G-Solve -
∫dx
Obtain the point of inflection
—
Analysis - G-Solve -
Inflection
Obtain the distance between two points
—
Analysis - G-Solve -
Distance
Obtain the volume of a solid of revolution
—
Analysis - G-Solve -
π ∫ (f (x))
2
dx
Modify a graph by changing the value of a coefficient - Analysis - Modify
Save a graph as image data (page 3-2-10) — a - Store Picture
Recall the image of a graph (page 3-2-10) — a - Recall Picture
Display the Graph Controller dialog box (page 3-5-4) — a - Graph Controller
Use a built-in function template to input a function for
graphing
— a - Built-In
•Note that built-in functions cannot be used for input
on the Graph Editor window.
Re-draw a graph — a - ReDraw
Generate a number table for an existing graph # —
Generate a summary table for an existing graph 4 —
Make the Graph Editor window active ! —
3-1-5
Graph & Table Application Overview