
User Manual
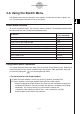
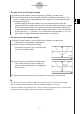
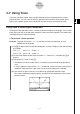
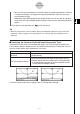
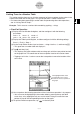
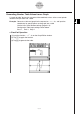
Table Of Contents
- Getting Ready
- Contents
- About This User’s Guide
- Chapter 1 Getting Acquainted
- Chapter 2 Using the Main Application
- 2-1 Main Application Overview
- 2-2 Basic Calculations
- 2-3 Using the Calculation History
- 2-4 Function Calculations
- 2-5 List Calculations
- 2-6 Matrix and Vector Calculations
- 2-7 Using the Action Menu
- 2-8 Using the Interactive Menu
- 2-9 Using the Main Application in Combination with Other Applications
- 2-10 Using Verify
- Chapter 3 Using the Graph & Table Application
- Chapter 4 Using the Conics Application
- Chapter 5 Using the 3D Graph Application
- Chapter 6 Using the Sequence Application
- Chapter 7 Using the Statistics Application
- 7-1 Statistics Application Overview
- 7-2 Using List Editor
- 7-3 Before Trying to Draw a Statistical Graph
- 7-4 Graphing Single-Variable Statistical Data
- 7-5 Graphing Paired-Variable Statistical Data
- 7-6 Using the Statistical Graph Window Toolbar
- 7-7 Performing Statistical Calculations
- 7-8 Test, Confidence Interval, and Distribution Calculations
- 7-9 Tests
- 7-10 Confidence Intervals
- 7-11 Distribution
- 7-12 Statistical System Variables
- Chapter 8 Using the Geometry Application
- Chapter 9 Using the Numeric Solver Application
- Chapter 10 Using the eActivity Application
- Chapter 11 Using the Presentation Application
- Chapter 12 Using the Program Application
- Chapter 13 Using the Spreadsheet Application
- Chapter 14 Using the Setup Menu
- Chapter 15 Configuring System Settings
- 15-1 System Setting Overview
- 15-2 Managing Memory Usage
- 15-3 Using the Reset Dialog Box
- 15-4 Initializing Your ClassPad
- 15-5 Adjusting Display Contrast
- 15-6 Configuring Power Properties
- 15-7 Specifying the Display Language
- 15-8 Specifying the Font Set
- 15-9 Specifying the Alphabetic Keyboard Arrangement
- 15-10 Optimizing “Flash ROM”
- 15-11 Specifying the Ending Screen Image
- 15-12 Adjusting Touch Panel Alignment
- 15-13 Viewing Version Information
- Chapter 16 Performing Data Communication
- Appendix
20050501
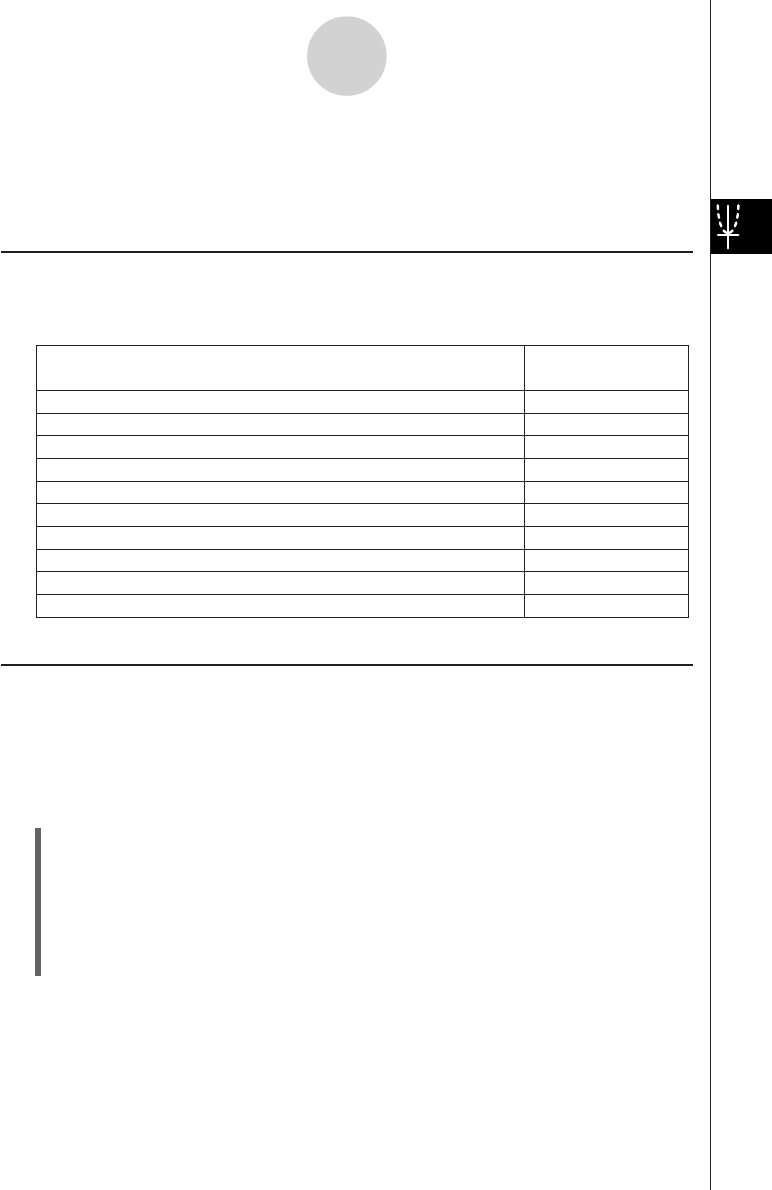
Clear figures and text you have added using the sketch feature
Plot a point on the Graph window
Draw a line on the Graph window
Write text on the Graph window
Draw a line that is tangent to a particular point on a graph
Draw a line that is normal to a particular point on a graph
Draw a circle
Draw a vertical line
Draw a horizontal line
Graph the inverse of a function
Cls
Plot
Line
Text
Tangent
Normal
Inverse
Circle
Vertical
Horizontal
Select this Sketch
menu command:
To do this:
3-6 Using the Sketch Menu
The [Sketch] menu lets you add points, lines, figures, and text after you draw a graph. You
can also add tangent and normal lines to your graph.
Sketch Menu Overview
To access the [Sketch] menu, tap [Analysis] and then [Sketch]. The following table describes
the commands that are available on the [Sketch] menu.
3-6-1
Using the Sketch Menu
Using Sketch Menu Commands
This section describes how to use each of the commands on the [Sketch] menu. Note that all
of the procedures in this section are performed in the Graph & Table application, which you
can enter by tapping the
T
icon on the application menu.
u To plot a point on the Graph window
(1) While the Graph window is active, tap [Analysis], [Sketch], and then [Plot].
(2) Tap the location on the Graph window where you want to plot a point.
• Instead of tapping the Graph window, you could also use the keypad to specify the
coordinates of the point. Pressing a number key displays a dialog box for inputting
coordinates. The value of the key you just pressed is input for the
x-coordinate. After inputting values for the x- and y-coordinates, tap [OK]
to plot the point at the location you specified.