
User Manual
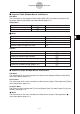
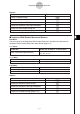
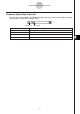
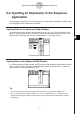
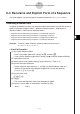
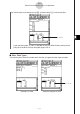
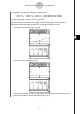
Table Of Contents
- Getting Ready
- Contents
- About This User’s Guide
- Chapter 1 Getting Acquainted
- Chapter 2 Using the Main Application
- 2-1 Main Application Overview
- 2-2 Basic Calculations
- 2-3 Using the Calculation History
- 2-4 Function Calculations
- 2-5 List Calculations
- 2-6 Matrix and Vector Calculations
- 2-7 Using the Action Menu
- 2-8 Using the Interactive Menu
- 2-9 Using the Main Application in Combination with Other Applications
- 2-10 Using Verify
- Chapter 3 Using the Graph & Table Application
- Chapter 4 Using the Conics Application
- Chapter 5 Using the 3D Graph Application
- Chapter 6 Using the Sequence Application
- Chapter 7 Using the Statistics Application
- 7-1 Statistics Application Overview
- 7-2 Using List Editor
- 7-3 Before Trying to Draw a Statistical Graph
- 7-4 Graphing Single-Variable Statistical Data
- 7-5 Graphing Paired-Variable Statistical Data
- 7-6 Using the Statistical Graph Window Toolbar
- 7-7 Performing Statistical Calculations
- 7-8 Test, Confidence Interval, and Distribution Calculations
- 7-9 Tests
- 7-10 Confidence Intervals
- 7-11 Distribution
- 7-12 Statistical System Variables
- Chapter 8 Using the Geometry Application
- Chapter 9 Using the Numeric Solver Application
- Chapter 10 Using the eActivity Application
- Chapter 11 Using the Presentation Application
- Chapter 12 Using the Program Application
- Chapter 13 Using the Spreadsheet Application
- Chapter 14 Using the Setup Menu
- Chapter 15 Configuring System Settings
- 15-1 System Setting Overview
- 15-2 Managing Memory Usage
- 15-3 Using the Reset Dialog Box
- 15-4 Initializing Your ClassPad
- 15-5 Adjusting Display Contrast
- 15-6 Configuring Power Properties
- 15-7 Specifying the Display Language
- 15-8 Specifying the Font Set
- 15-9 Specifying the Alphabetic Keyboard Arrangement
- 15-10 Optimizing “Flash ROM”
- 15-11 Specifying the Ending Screen Image
- 15-12 Adjusting Touch Panel Alignment
- 15-13 Viewing Version Information
- Chapter 16 Performing Data Communication
- Appendix
20050501
Graphing a Recursion
An expression can be graphed as a connect type graph (G-Connect) or a plot type graph
(G-Plot).
Example: To graph an+1 = 2an+1, a1 = 1
u ClassPad Operation
(1) Start up the Sequence Editor.
• If you have another application running, tap m and then H.
• If you have the Sequence application running, tap O and then [Sequence Editor].
(2) Tap the [Recursive] tab.
(3) Specify the recursion type by tapping [Type] and then [an+1Type a1].
(4) Input the recursion expression.
•Tap the input box to the right of an+1:, and then use the procedures under “6-2
Inputting an Expression in the Sequence Application” to input the following.
2 [n,an] [an]+1E
(5) Input the initial value.
1E
(6) Tap O and then [Settings] and [View Window].
• This displays a dialog box for configuring View Window settings.
6-3-3
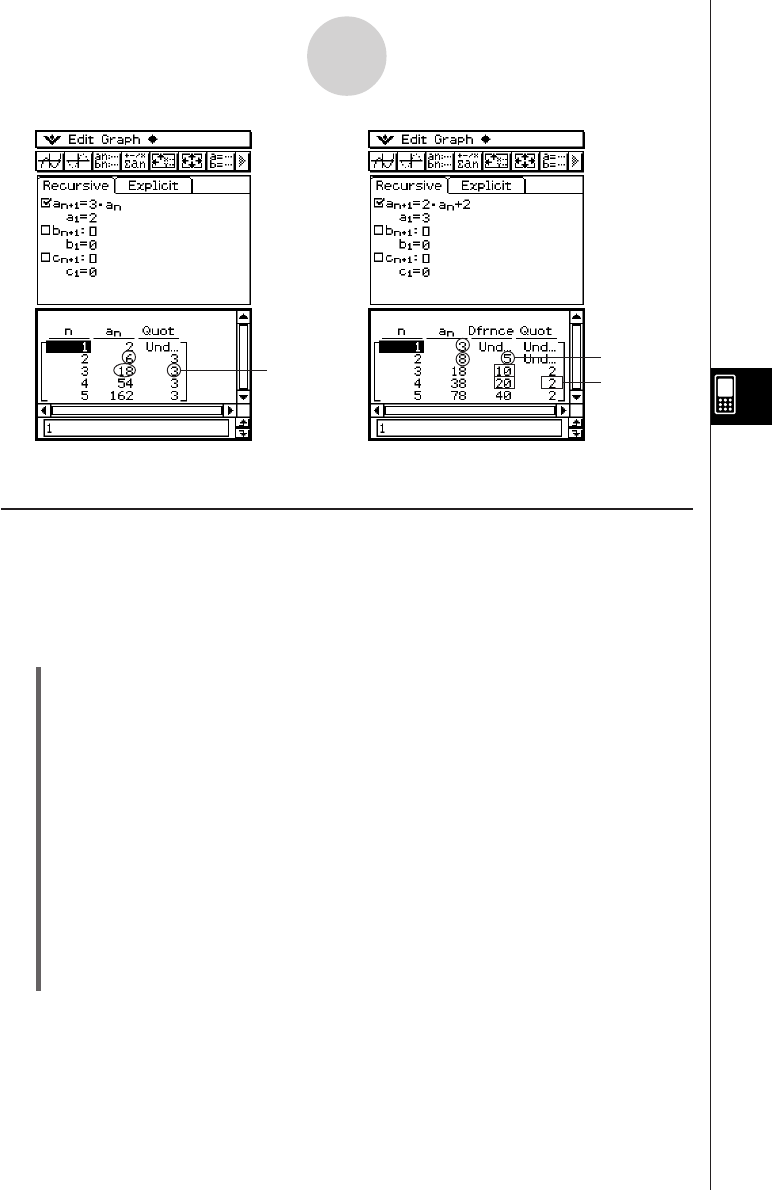
Recursive and Explicit Form of a Sequence
Geometric Sequence Table
Progression of Difference
Table
3 = 18 ÷ 6
5 = 8 – 3
2 = 20 ÷ 10