
User Manual
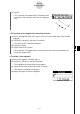
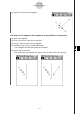
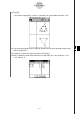
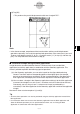
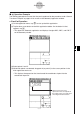
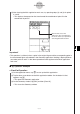
Table Of Contents
- Getting Ready
- Contents
- About This User’s Guide
- Chapter 1 Getting Acquainted
- Chapter 2 Using the Main Application
- 2-1 Main Application Overview
- 2-2 Basic Calculations
- 2-3 Using the Calculation History
- 2-4 Function Calculations
- 2-5 List Calculations
- 2-6 Matrix and Vector Calculations
- 2-7 Using the Action Menu
- 2-8 Using the Interactive Menu
- 2-9 Using the Main Application in Combination with Other Applications
- 2-10 Using Verify
- Chapter 3 Using the Graph & Table Application
- Chapter 4 Using the Conics Application
- Chapter 5 Using the 3D Graph Application
- Chapter 6 Using the Sequence Application
- Chapter 7 Using the Statistics Application
- 7-1 Statistics Application Overview
- 7-2 Using List Editor
- 7-3 Before Trying to Draw a Statistical Graph
- 7-4 Graphing Single-Variable Statistical Data
- 7-5 Graphing Paired-Variable Statistical Data
- 7-6 Using the Statistical Graph Window Toolbar
- 7-7 Performing Statistical Calculations
- 7-8 Test, Confidence Interval, and Distribution Calculations
- 7-9 Tests
- 7-10 Confidence Intervals
- 7-11 Distribution
- 7-12 Statistical System Variables
- Chapter 8 Using the Geometry Application
- Chapter 9 Using the Numeric Solver Application
- Chapter 10 Using the eActivity Application
- Chapter 11 Using the Presentation Application
- Chapter 12 Using the Program Application
- Chapter 13 Using the Spreadsheet Application
- Chapter 14 Using the Setup Menu
- Chapter 15 Configuring System Settings
- 15-1 System Setting Overview
- 15-2 Managing Memory Usage
- 15-3 Using the Reset Dialog Box
- 15-4 Initializing Your ClassPad
- 15-5 Adjusting Display Contrast
- 15-6 Configuring Power Properties
- 15-7 Specifying the Display Language
- 15-8 Specifying the Font Set
- 15-9 Specifying the Alphabetic Keyboard Arrangement
- 15-10 Optimizing “Flash ROM”
- 15-11 Specifying the Ending Screen Image
- 15-12 Adjusting Touch Panel Alignment
- 15-13 Viewing Version Information
- Chapter 16 Performing Data Communication
- Appendix
20050501
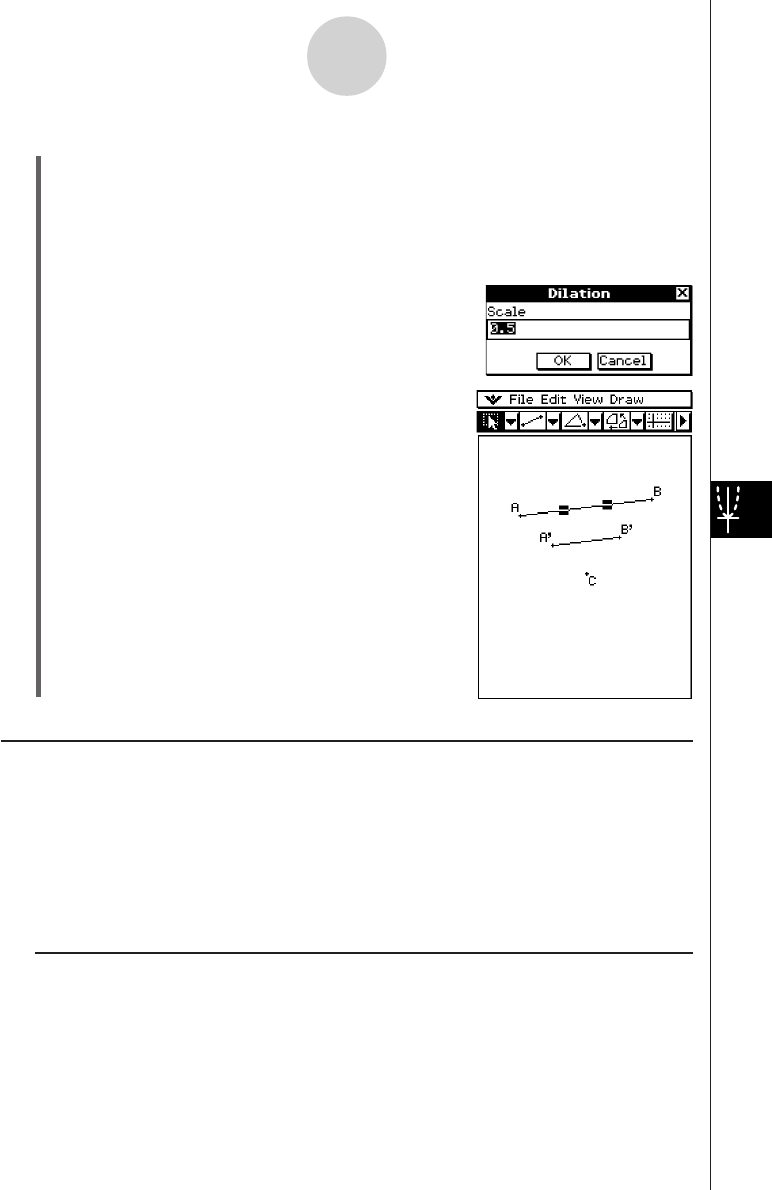
u To dilate a line segment toward a specified center point
(1) Draw a line segment, and then select it.
(2) Tap [Draw], [Construct], and then [Dilation].
• This highlights the dilation button on the toolbar.
(3) Tap the center of dilation.
• This displays the Dilation dialog box.
(4) Specify the dilation scale factor.
(5) Tap [OK].
8-2-19
Drawing Figures
Transformation Using a Matrix or Vector (General Transform)
General Transform lets you input a matrix and/or vector to transform a figure. The result of
the transformation is drawn as a separate figure. For example, if you transform line segment
AB, the line segment A’B’ will be drawn.
You can perform the following types of transformations with General Transform.
• Matrix Transformation: x-axis/y-axis symmetry, rotation, enlargement, reduction, etc.
• Vector Transformation: Vertical and horizontal parallel displacement
k General Transform Example
In this example draw triangle ABC and then draw triangle A’B’C’, which is symmetrical to
ABC about the x-axis. Next, we will draw triangle A’’B’’C’’ by performing a parallel
displacement on triangle A’B’C’ of 1 unit along the x- and y-axis.