
User Manual
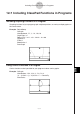
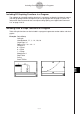
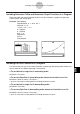
Table Of Contents
- Getting Ready
- Contents
- About This User’s Guide
- Chapter 1 Getting Acquainted
- Chapter 2 Using the Main Application
- 2-1 Main Application Overview
- 2-2 Basic Calculations
- 2-3 Using the Calculation History
- 2-4 Function Calculations
- 2-5 List Calculations
- 2-6 Matrix and Vector Calculations
- 2-7 Using the Action Menu
- 2-8 Using the Interactive Menu
- 2-9 Using the Main Application in Combination with Other Applications
- 2-10 Using Verify
- Chapter 3 Using the Graph & Table Application
- Chapter 4 Using the Conics Application
- Chapter 5 Using the 3D Graph Application
- Chapter 6 Using the Sequence Application
- Chapter 7 Using the Statistics Application
- 7-1 Statistics Application Overview
- 7-2 Using List Editor
- 7-3 Before Trying to Draw a Statistical Graph
- 7-4 Graphing Single-Variable Statistical Data
- 7-5 Graphing Paired-Variable Statistical Data
- 7-6 Using the Statistical Graph Window Toolbar
- 7-7 Performing Statistical Calculations
- 7-8 Test, Confidence Interval, and Distribution Calculations
- 7-9 Tests
- 7-10 Confidence Intervals
- 7-11 Distribution
- 7-12 Statistical System Variables
- Chapter 8 Using the Geometry Application
- Chapter 9 Using the Numeric Solver Application
- Chapter 10 Using the eActivity Application
- Chapter 11 Using the Presentation Application
- Chapter 12 Using the Program Application
- Chapter 13 Using the Spreadsheet Application
- Chapter 14 Using the Setup Menu
- Chapter 15 Configuring System Settings
- 15-1 System Setting Overview
- 15-2 Managing Memory Usage
- 15-3 Using the Reset Dialog Box
- 15-4 Initializing Your ClassPad
- 15-5 Adjusting Display Contrast
- 15-6 Configuring Power Properties
- 15-7 Specifying the Display Language
- 15-8 Specifying the Font Set
- 15-9 Specifying the Alphabetic Keyboard Arrangement
- 15-10 Optimizing “Flash ROM”
- 15-11 Specifying the Ending Screen Image
- 15-12 Adjusting Touch Panel Alignment
- 15-13 Viewing Version Information
- Chapter 16 Performing Data Communication
- Appendix

20050501
12-7-3
Including ClassPad Functions in Programs
Including Recursion Table and Recursion Graph Functions in a Program
Recursion table and recursion graph functions can be included in a program to generate
number tables and draw graphs.
Example: DefaultSetup
ViewWindow 0, 6, 1, –0.01, 0.3, 1
SeqType "an+1a0"
"–3an^2 + 2an" S an+1
0 S SqStart
6 S SqEnd
0.01 S a0
DispSeqTbl
Pause
DrawSeqCon
Including List Sort Functions in a Program
List sort functions let you sort list data into either ascending or descending order. Make sure
the list contains data before executing a sort function.
u To sort data of a single list in ascending order
MultiSortA <list name>
u To sort multiple lists in ascending order, based on the data in one list
MultiSortA <base list name>,<list name>,…
•Up to six list names can be specified, including the base list name.
u To sort data of a single list in descending order
MultiSortD <list name>
u To sort multiple lists in descending order, based on the data in one list
MultiSortD <base list name>,<list name>,…
•Up to six list names can be specified, including the base list name.