
User Manual
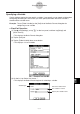

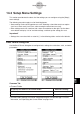
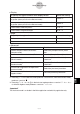
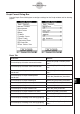
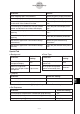
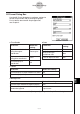
Table Of Contents
- Getting Ready
- Contents
- About This User’s Guide
- Chapter 1 Getting Acquainted
- Chapter 2 Using the Main Application
- 2-1 Main Application Overview
- 2-2 Basic Calculations
- 2-3 Using the Calculation History
- 2-4 Function Calculations
- 2-5 List Calculations
- 2-6 Matrix and Vector Calculations
- 2-7 Using the Action Menu
- 2-8 Using the Interactive Menu
- 2-9 Using the Main Application in Combination with Other Applications
- 2-10 Using Verify
- Chapter 3 Using the Graph & Table Application
- Chapter 4 Using the Conics Application
- Chapter 5 Using the 3D Graph Application
- Chapter 6 Using the Sequence Application
- Chapter 7 Using the Statistics Application
- 7-1 Statistics Application Overview
- 7-2 Using List Editor
- 7-3 Before Trying to Draw a Statistical Graph
- 7-4 Graphing Single-Variable Statistical Data
- 7-5 Graphing Paired-Variable Statistical Data
- 7-6 Using the Statistical Graph Window Toolbar
- 7-7 Performing Statistical Calculations
- 7-8 Test, Confidence Interval, and Distribution Calculations
- 7-9 Tests
- 7-10 Confidence Intervals
- 7-11 Distribution
- 7-12 Statistical System Variables
- Chapter 8 Using the Geometry Application
- Chapter 9 Using the Numeric Solver Application
- Chapter 10 Using the eActivity Application
- Chapter 11 Using the Presentation Application
- Chapter 12 Using the Program Application
- Chapter 13 Using the Spreadsheet Application
- Chapter 14 Using the Setup Menu
- Chapter 15 Configuring System Settings
- 15-1 System Setting Overview
- 15-2 Managing Memory Usage
- 15-3 Using the Reset Dialog Box
- 15-4 Initializing Your ClassPad
- 15-5 Adjusting Display Contrast
- 15-6 Configuring Power Properties
- 15-7 Specifying the Display Language
- 15-8 Specifying the Font Set
- 15-9 Specifying the Alphabetic Keyboard Arrangement
- 15-10 Optimizing “Flash ROM”
- 15-11 Specifying the Ending Screen Image
- 15-12 Adjusting Touch Panel Alignment
- 15-13 Viewing Version Information
- Chapter 16 Performing Data Communication
- Appendix
20050501
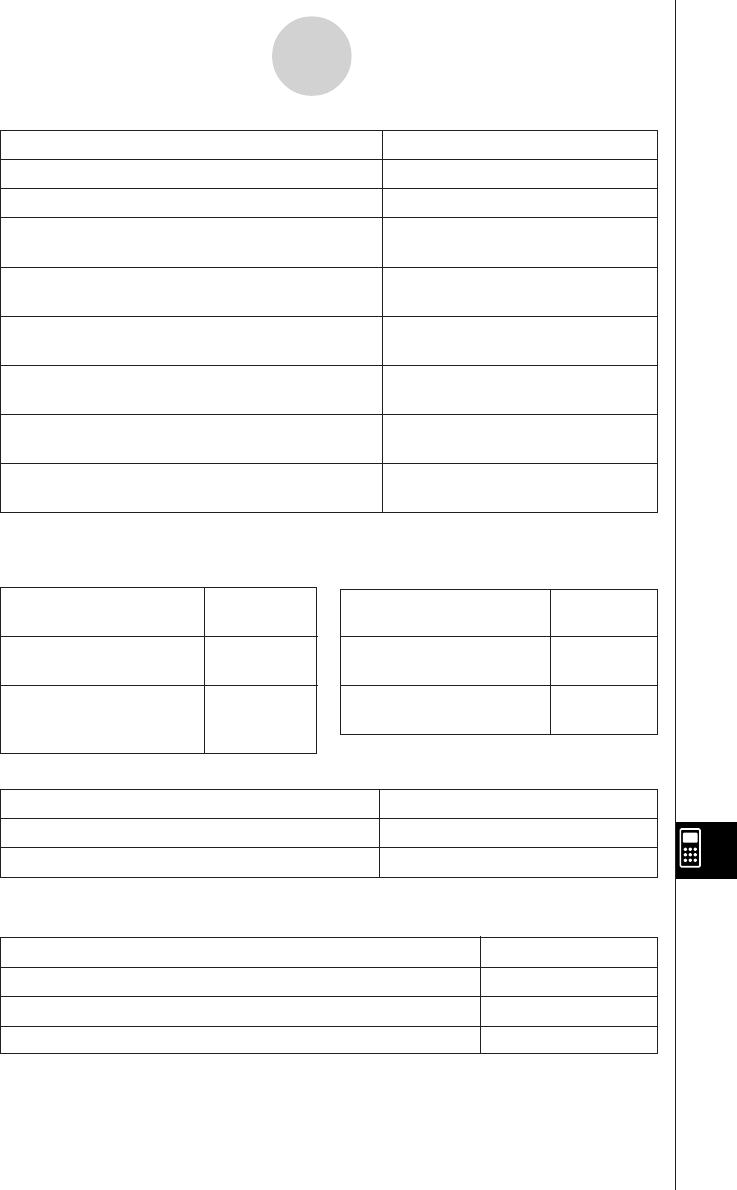
To do this: Do this:
Draw multiple graphs simultaneously Select the [Simul Graph] check box.
Draw multiple graphs one-by-one Clear the [Simul Graph] check box.*
Turn on display of coordinates of your graph and Select the [Derivative/Slope] check
its derivative in the Ordered Pair table box.
Turn off display of coordinates of Graph window Clear the [Derivative/Slope] check
pointer and derivative on number table display box.*
Turn on display of graph controller arrows during Select the [G-Controller] check
graphing box.*
Turn off display of graph controller arrows during
graphing
Clear the [G-Controller] check box.
Set Statistics application View Window settings Select the [Stat Window Auto]
automatically check box.*
Set Statistics application View Window settings Clear the [Stat Window Auto] check
manually box.
14-3-5
Setup Menu Settings
u Background
To do this:
Select this
setting:
Turn off Graph window
background display
Off*
Select an image to be
used as the Graph window <pict name>
background
u Draw Type
To do this:
Select this
setting:
Draw graphs with plotted
points only
Plot
Draw graphs with plotted
points connected by lines
Connect*
Special Tab
• The above is the same as the [∑display] setting on the Basic Format dialog box.
u Set Sequence
u ∑display
To do this: Select this setting:
Turn on display of subtotals for sequence tables On
Turn off display of subtotals for sequence tables Off*
To do this: Select this setting:
Turn on display of expressions created after graph drawing On*
Turn off display of expressions created after graph drawing Off
Require pressing of E for expression display StepDisp